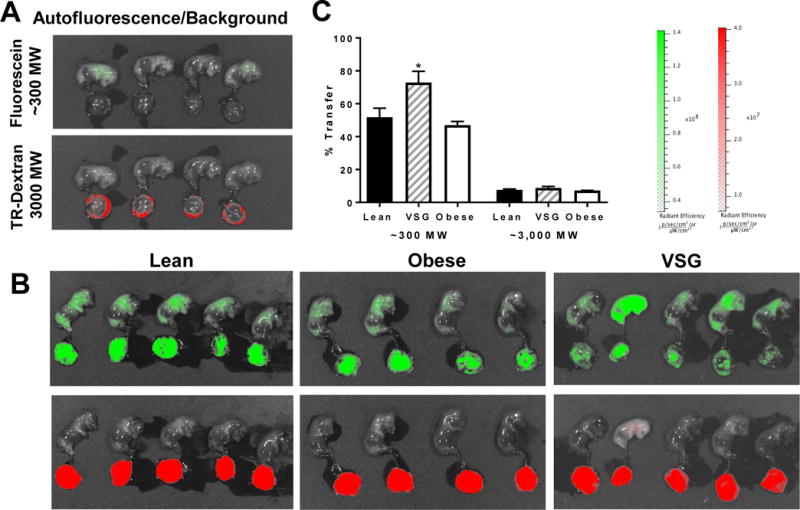
Figure 8. Imaging of G19 fetal placental units in Lean, VSG and Obese pregnancies.

(A) Background/autofluorescence levels in each channel. (B) Images of fetuses and placenta in red and green channels after injection of ~300 Dalton fluorescein and 3000 Dalton Texas red labeled dextran. N =3-6/group, 3 saline controls. (C) Percent transfer of each of the two labelled chemicals. Student’s T test, *P < 0.05. Data are presented as mean ±SEM.
