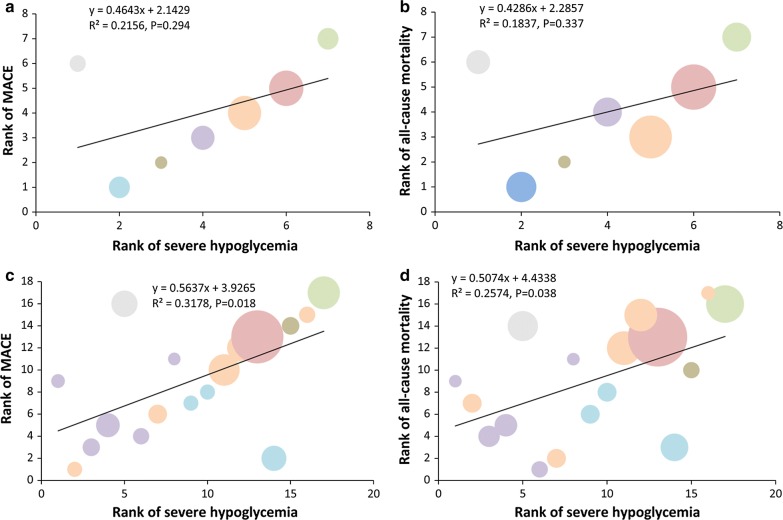
Fig. 4.
Correlation analyses showing correlation between the ranking order of MACE and all-cause mortality risk and the ranking order of severe hypoglycemia risk. Color of circle represents different drugs shown above. Area of a circle reflects sample size. a, b, c, d The panels indicates the correlation relationship between severe hypoglycemia and outcome of interest according to the ranking order

