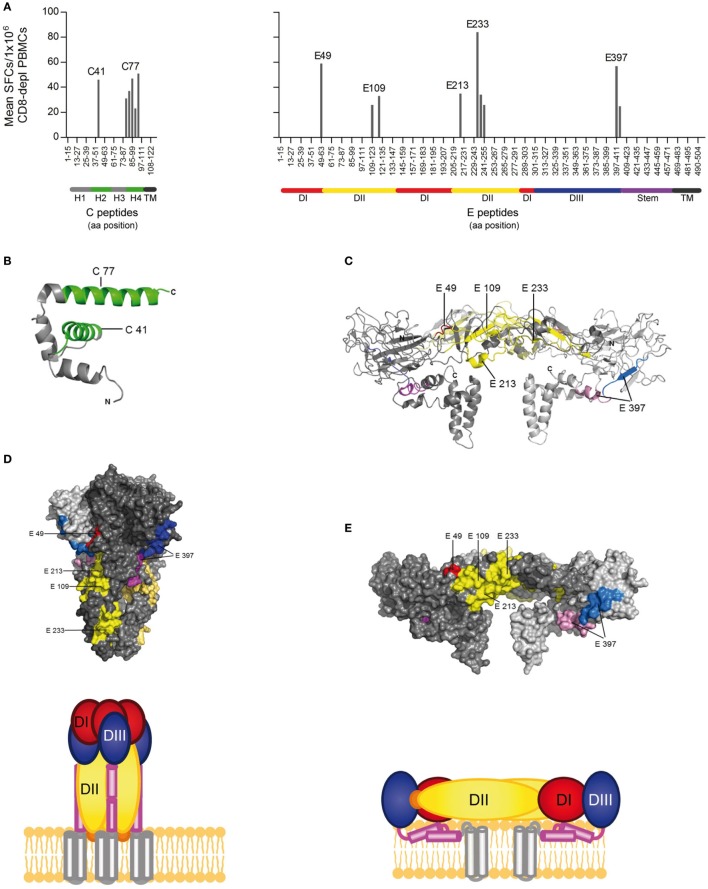
Figure 2.
CD4 T cell epitope mapping for Zika virus (ZIKV) C and E proteins. (A) Mean spot count of immunodominant responses to single peptides detected in ≥20% of Zika patients. Amino acid positions of peptides in C and E protein sequences are indicated on the x-axes. Epitope clusters are denoted by the first amino acid of the N-terminal 15-mer peptide used for single-peptide testing. (B) Ribbon representation of the flavivirus Kunjin (KUN) C protein (PDB 1SFK) (28), comprising four helices. (C) Ribbon representation of the ZIKV E dimer (PDB 5IZ7; side view) (6), consisting of the three domains (DI–III), the stem, and transmembrane anchor. ZIKV epitopes recognized by ≥20% of Zika patients are colored as follows: C—green; E: domain I—red; domain II—yellow; domain III—blue; stem—purple, transmembrane domain (TM)—black. (D) Surface representation of the truncated dengue (DEN)-1 virus postfusion trimeric form of E and a schematic showing a model of the full-length trimer (DEN-1; PDB 4GT0; side view) (29). (E) Surface representation of the ZIKV E dimer (PDB 5IZ7; side view) and the corresponding schematic.

