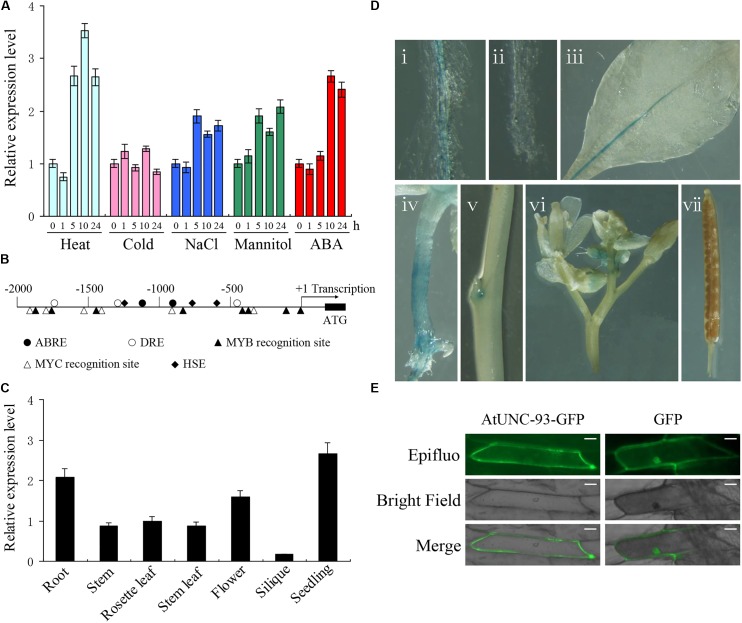
FIGURE 1.
Expression pattern and subcellular localization of AtUNC-93. (A) Expression levels of AtUNC-93 under abiotic stress and ABA treatments. (B) Distribution of major stress-related cis-elements in the promoter region of AtUNC-93. (C) Expression levels of AtUNC-93 expression in different tissues as indicated. (D) Expression pattern of AtUNC-93 determined in ProAtUNC-93:GUS transgenic Arabidopsis plants. The GUS staining of primary root (i), primary root tip (ii), leaf (iii), hypocotyl (iv), stem (v), flower (vi), and silique (vii). (E) Subcellular localization analysis of AtUNC-93-GFP in onion epidermic cells. The expression of GFP alone was used as controls. Bars = 50 μm. Data in (A,C) represent the means ± standard error (SE) (n = 3), 3 independent experiments.

