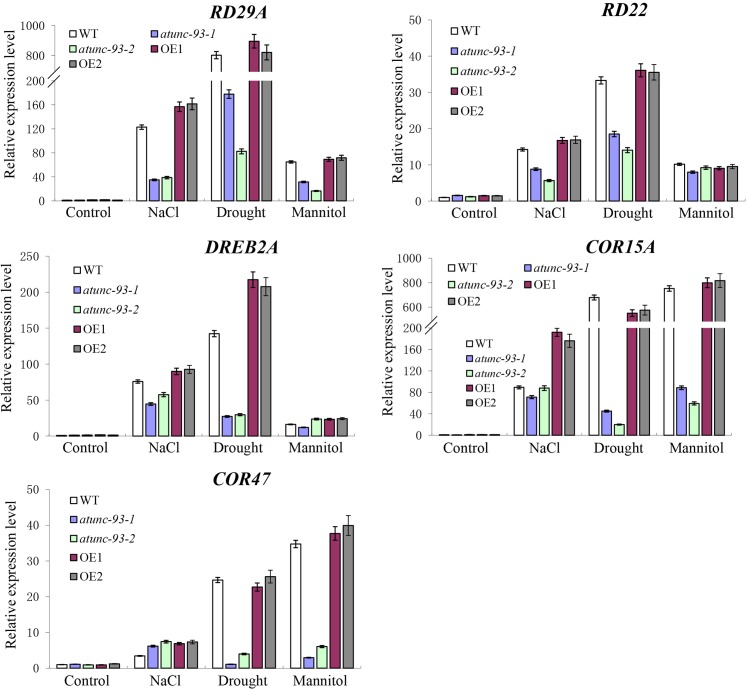
FIGURE 4.
Expression of the stress-related genes in atunc-93 mutants and AtUNC-93-overexpressing lines under stress conditions. The expression levels of RD29A, RD22, DREB2A, COR15A, and COR47 were determined by using real-time PCR under NaCl, drought and mannitol treatments. Seedlings before stress treatments were used as controls. Each data bar represents the mean ± SE (n = 3).

