FIGURE 6.

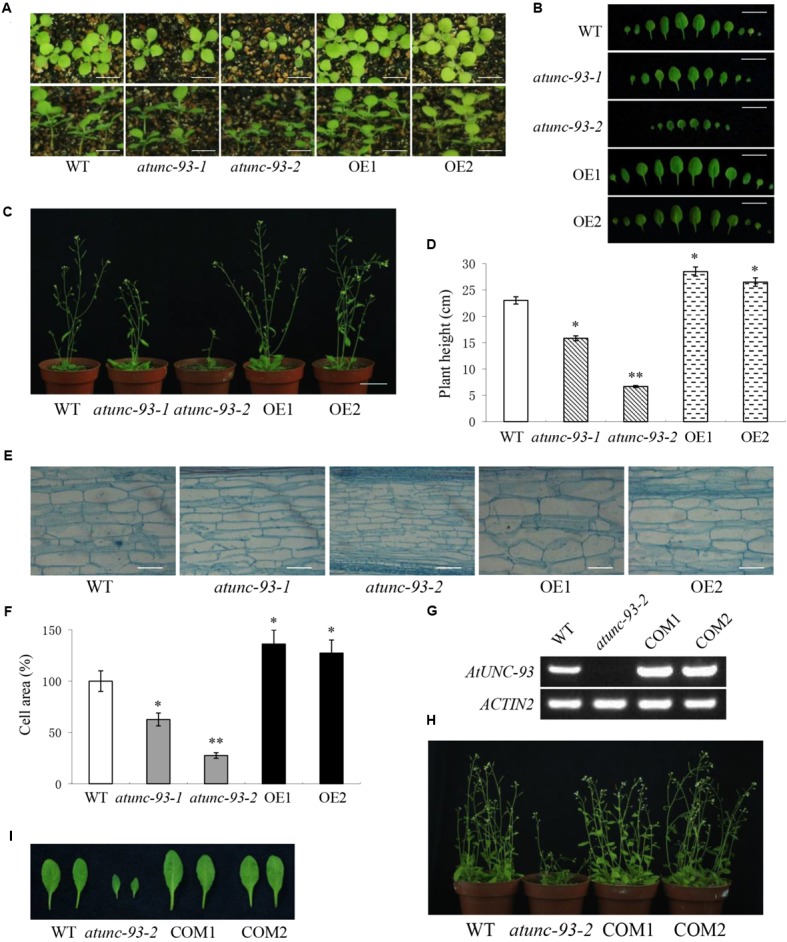
Plant growth phenotypes of the wild type, atunc-93 mutants and AtUNC-93-overexpressing plants. (A) 14-day-old seedlings grown in soil pots. Bars = 5 mm. (B) Rosette leaves of 21-day-old seedlings. Bars = 10 mm. (C,D) Phenotype (C) and plant height (D) of 6-week-old plants. Bars = 30 mm. (E,F) Stem cells comparison (E) and cell areas (F) of 6-week-old plants. Bars = 100 μm. Relative cell areas were calculated from the microscope image data using ImageJ. (G) RT-PCR verification of AtUNC-93 expression levels in the wild type, atunc-93-2 and complementation lines (COM1 and COM2). (H,I) Phenotype comparison (H) and rosette leaves (I) of the wild type, atunc-93-2 and complementation plants grown in soil pots for 6 weeks. Data in (D,F) are shown as means ± SD (n = 30), thirty plants or cells were tested. Student’s t-test (∗P < 0.05 and ∗∗P < 0.01) was used to analyze statistical significance compared with the wild type.
