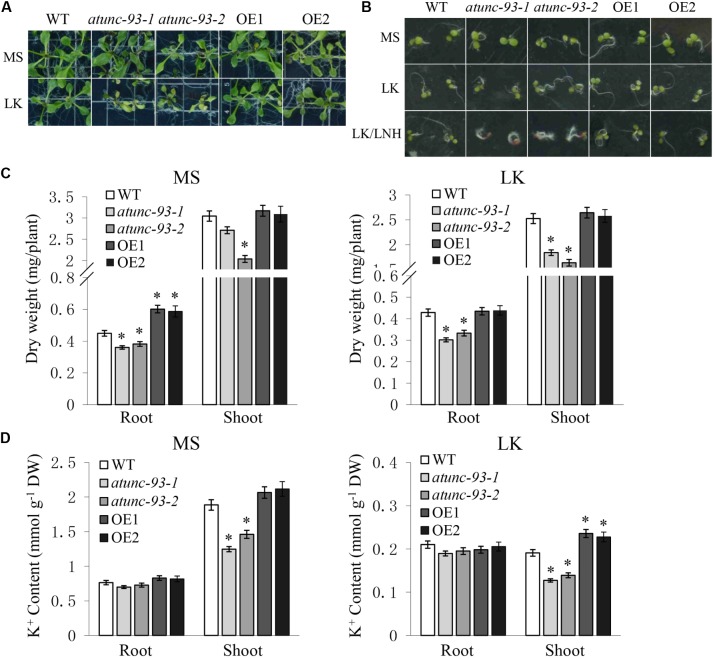
FIGURE 7.
Phenotype tests and K+ content measurements of the wild type, atunc-93 mutants and AtUNC-93-overexpressing lines under low-K+ conditions. (A) Phenotype of various materials after being transferred to MS or LK medium for 10 days. MS indicates Murashige and Skoog medium (20 mM K+, 20 mM NH4+). LK indicates modified MS medium containing low-K+ concentration (100 μM K+, 30 mM NH4+). (B) Phenotype comparison of various materials after the seeds germinated directly on MS, LK or LK/LNH medium for 4 days. MS and LK indicate as shown in (A). LK/LNH indicates modified MS medium containing low-K+ and low-NH4+ concentration (100 μM K+, 1.25 mM NH4+). (C,D) Dry weight (C) and K+ content (D) of various plant materials as indicated under MS and LK conditions. Data are shown as means ± SE (n = 3). Student’s t-test (∗P < 0.05) was used to analyze statistical significance compared with the wild type.

