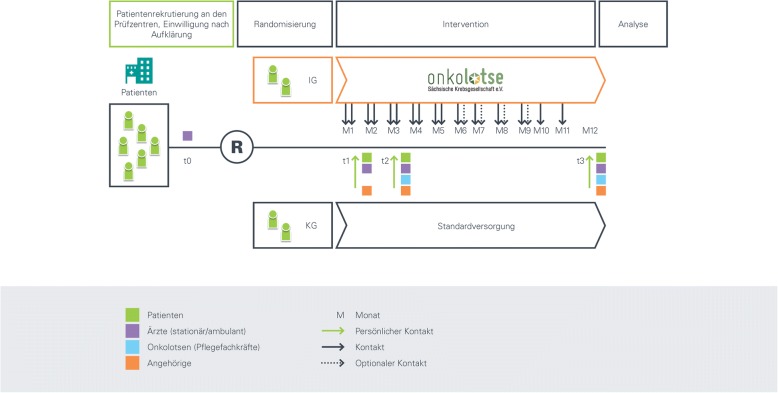
Fig. 1.
Study procedure. The figure shows the study flow from informed consent to randomization, intervention and analysis. Green arrows show personal contacts, black arrows any contact, dashed arrows optional contacts between study participants. M = month, R = randomization, t = time point#. Box colors: Green = patients, purple = physicians, blue = cancer patient navigators, orange = family members

