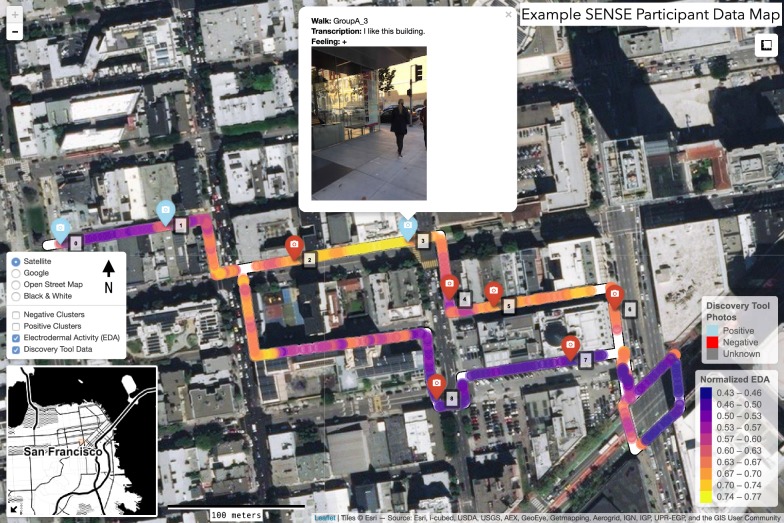
Fig. 1.
Example of an interactive webpage built for participants to view and interpret their data. The red and blue markers show where this specific participant took photographs with the DT app. The participant’s path is color-coded by their EDA level, from dark purple to yellow (low to high). The complete html file and underlying R code has been uploaded as Additional files 1 and 2

