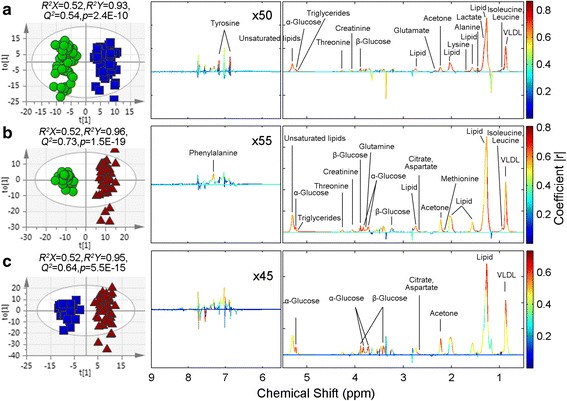
Fig. 3.

Orthogonal partial least squares-discriminant analysis score plots of samples (left panel) and corresponding coefficient loading plots (right panel) obtained from different pairwise groups: a hyperuricemia (HUA) (blue dots) and control groups (green dots); b gout (red dots) and control groups (green dots); c gout (red dots) and HUA (blue dots). The color bar on the right corresponds to the weight of a variable in the discrimination between sets of samples, beginning from weak (blue) to strong (red) correlation for the discrimination. VLDL, very low-density lipoprotein
