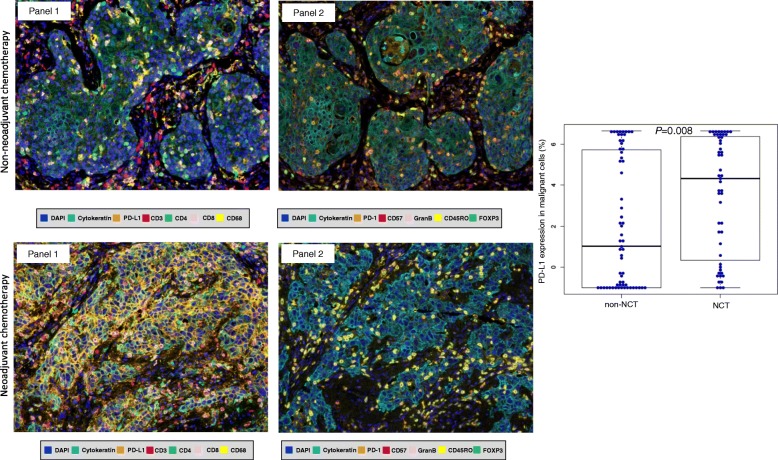
Fig. 1.
Representative multiplex immunofluorescences and PD-L1 expression in non-NCT and NCT. (Left) Multiplex immunofluorescence images of representative NSCLC tumor sections analyzed for panel 1 and panel 2 markers: upper images are from the group that did not receive neoadjuvant chemotherapy (non-NCT), while the lower images are from the group that did receive NCT. The images reflect the variations in cell phenotypes observed in these cases. (Right) Box plot showing that PD-L1 expression by malignant NSCLC cells was higher in the group that received NCT than in the non-NCT group. Images ×200

