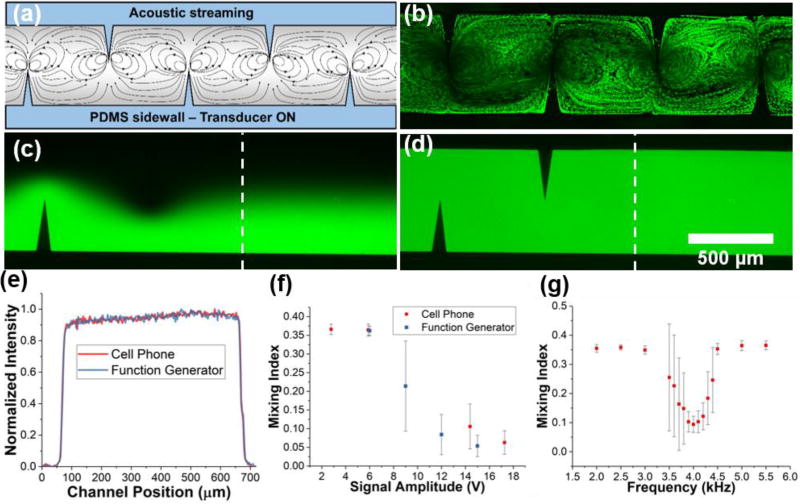
Fig. 3.
(a) Schematic of mixing induced by acoustic streaming in the channel. (b) Fluorescent green particle tracing to visualize the streaming patterns. Fluorescein and DI water (c) before and (d) after being mixed by the acoustofluidic device controlled with a cell phone. (e) Normalized intensity profiles across the channel width (dashed lines in Fig. 3c–d) indicate the location at which the intensity profile was measured). (f) Mixing index versus signal voltage from the cell phone and function generator. Voltage value for the cell phone correspond to the 40, 60, 80, and 100% volume levels. (g) Mixing index versus frequency of applied signal from the cell phone. Q = 2.0 µL/min from each inlet for mixing experiments. Data represents average of n = 3 independent devices ± standard deviation.

