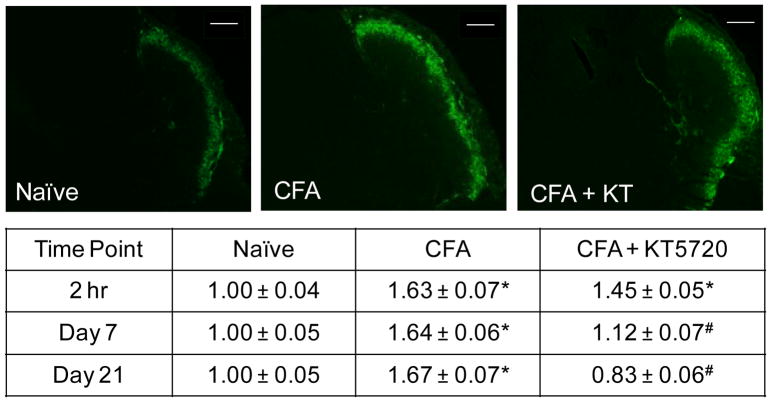
Fig. 1.
CFA stimulation of CGRP expression in the STN is repressed by inhibition of PKA activity. Representative images of sections from the STN obtained at the 2 hour time point from naïve, CFA injected, or CFA injection and intrathecal administration of KT5720 animals are shown. The average change in relative staining intensity from naïve levels for CGRP at 2 hours, 7 days, and 21 days after injections is reported. Data are reported as a fold-change ± SEM from levels in naïve animals, whose mean was made equal to one. * P < .05 when compared to naïve control levels and # P < .05 when compared to CFA levels. Scale bar = 200 μm.

