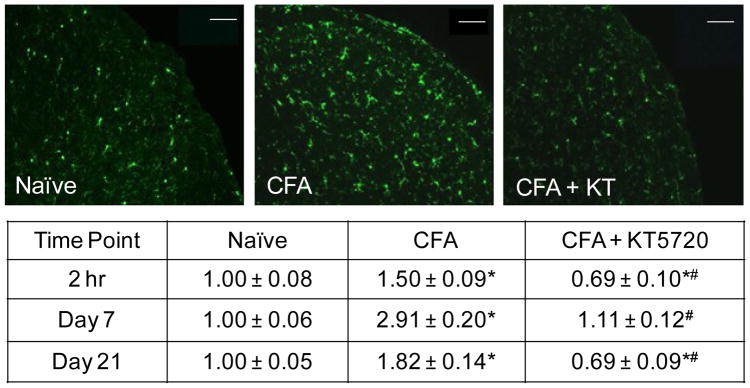
Fig. 3.
CFA-mediated increase in Iba1 in microglia is inhibited by intrathecal PKA inhibitor. Representative images of sections of the STN obtained at the 2 hour time point from naïve, CFA injected, or CFA injection + KT5720 animals are shown. The average change in relative staining intensity from naïve levels for Iba1 at 2 hr, 7 days, and 21 days after injections is reported. Data are reported as a fold-change ± SEM from levels in naïve animals, whose mean was made equal to one. * P < .05 when compared to naïve control levels and # P < .05 when compared to CFA levels. Scale bar = 100 μm.

