
FIGURE 5.
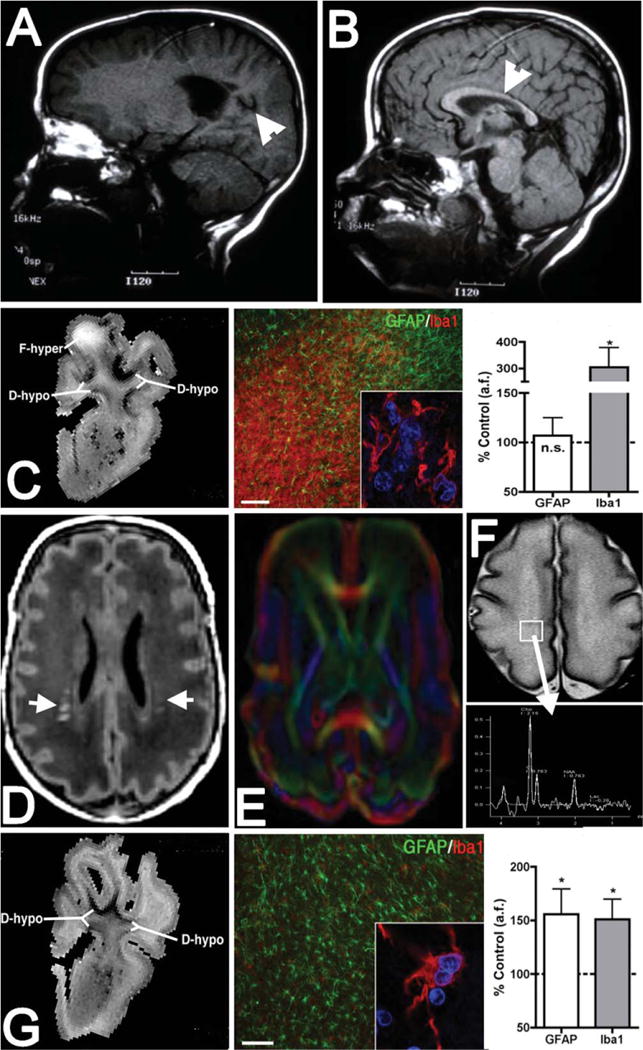
Diagnostic and experimental magnetic resonance imaging (MRI) approaches to define dysmaturation processes related to white matter injury (WMI). (A, B) MRI (1.5T; T1) appearance of marked cystic necrotic human WMI (A; arrowhead) adjacent to the lateral ventricle, which is associated with white matter volume loss that involves the corpus callosum (B; arrowhead). (C) High-field MRI–defined focal necrotic WMI and corresponding histopathological features. WMI was analyzed at 1 or 2 weeks after global cerebral ischemia in 0.65 gestation fetal sheep (adapted from Riddle et al50). At left is a representative T2-weighted image of a large focal hyperintense (F-hyper) lesion detected at 1 week. Note the hypointense diffuse WMI (D-hypo), discussed in G, below. In the center is a typical necrotic lesion defined by focal staining for reactive microglia and macrophages with Iba1 (red and inset) and a paucity of glial fibrillary acidic protein (GFAP)-labeled astrocytes. Nuclei in the inset are visualized with Hoechst 33342 (blue). At right, by 2 weeks after ischemia, necrotic WMI displayed a progressive decrease in GFAP-labeled astrocytes and a pronounced increased in Iba1-labeled macrophages and microglia. *p < 0.05; bar in C = 100μm. n.s. = nonsignificant. (D) Diffuse human WMI on diagnostic MRI (1.5T; T1) has the appearance of bilateral multifocal signal hyperintensities (arrows). (E) Diffusion tensor imaging (DTI) defines the microstructure of white matter tracts and can be used to follow the chronic progression of diffuse WMI. (F) Magnetic resonance spectroscopic imaging (MRSI) can be applied to define biochemical and metabolic abnormalities associated with diffuse WMI. Both DTI and MRSI detect abnormalities beyond the areas of signal abnormality on T1-weighted images. (G) Diffuse fetal ovine WMI defined at 12T as in C.50 At left is a representative image of diffuse hypointense (D-hypo) WMI seen on a T2-weighted image at 1 week after ischemia. In the center are typical histopathological features of diffuse WMI: pronounced astrogliosis defined by staining of reactive astrocytes with GFAP (green) and a less activated population of Iba1-labeled microglia/macrophages (red and inset). At right, quantification of the area fraction (a.f.) of astrocytes and microglia in diffuse WMI at 2 weeks after ischemia is shown. There was significantly elevated GFAP and Iba1 staining, consistent with a diffuse gliotic response to WMI. *p < 0.05; bar in G = 100μm. Images in A and B are courtesy of Dr Patrick Barnes, Stanford University.