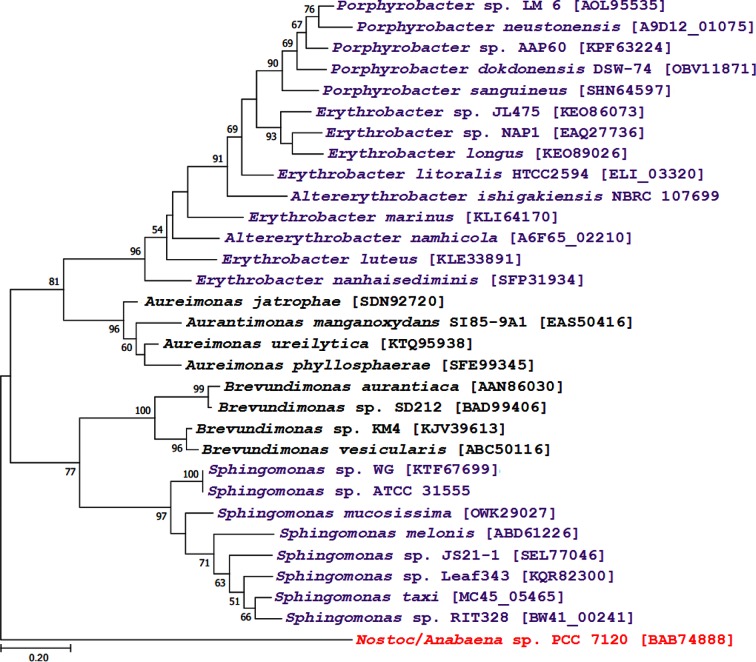
Fig. 3.
Phylogenetic tree based on CrtW homologues. The analysis involved 31 sequences and the tree was constructed using the maximum-likelihood method (with the LG+F substitution model) in mega 7.0. Bootstrap values of 1000 replicates are indicated as numbers out of 100 at the nodes (only values >50 are shown). All positions containing gaps and missing data were eliminated, and the final dataset contained 214 positions. Purple text indicates CrtW from strains of Sphingomonadales. Black text indicates CrtW from taxa distantly related to Sphingomonadales. Red text indicates the outgroup CrtW sequence. GenBank accession numbers are provided in square brackets. The tree is drawn to scale. Bar, the number of amino acid substitutions per site.

