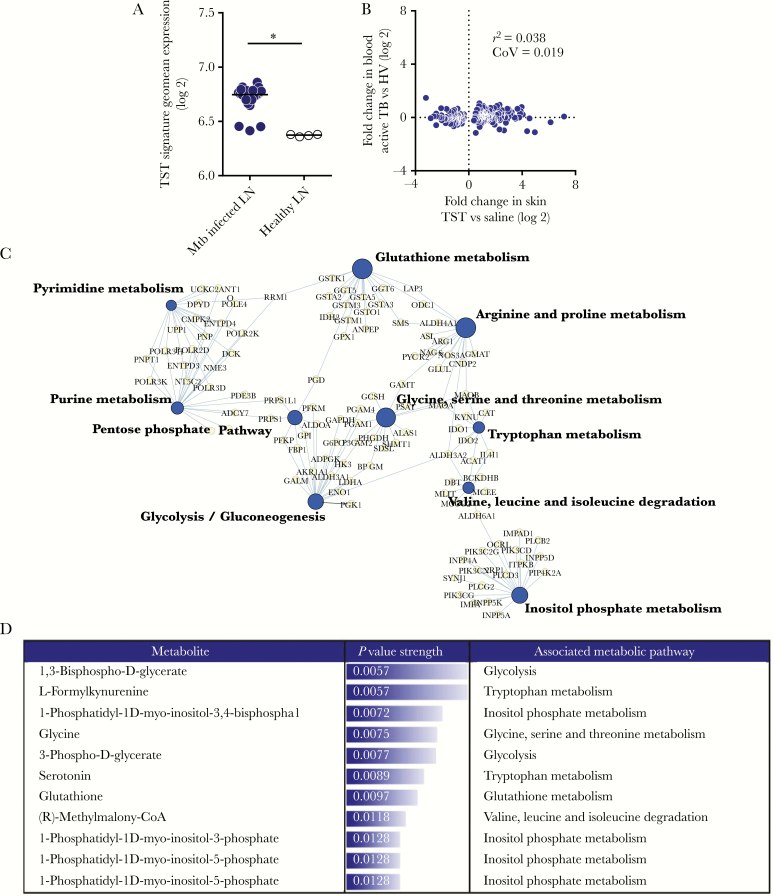
Figure 1.
Metabolic pathways enriched in tuberculin skin test (TST) responses relative to saline injection. A, Expression of TST signature in Mycobacterium tuberculosis (Mtb)-infected lymph nodes (LN) relative to healthy LN. Each dot represents 1 sample. Horizontal lines represent median value expression. * P < .0001 by Mann-Whitney test. B, Pairwise comparison of 292 genes differentially expressed in TST relative to saline injection compared to the expression difference between the blood of patients with active tuberculosis (TB) and healthy volunteers (HV). C, The top 10 most statistically enriched KEGG metabolic pathways in the TST relative to saline injection are represented in a network plot, in which the edges indicate associations between genes (light gray nodes) and named pathways (dark gray nodes), and the node size is proportional to the respective pathway −log10 P value enrichment statistic. D, Reporter metabolites predicted to be differentially expressed in TST compared to saline injection. Metabolites selected for known association with metabolic pathways and ranked by increasing P value. Abbreviations: r2, Spearman rank correlation coefficient; CoV, covariance.

