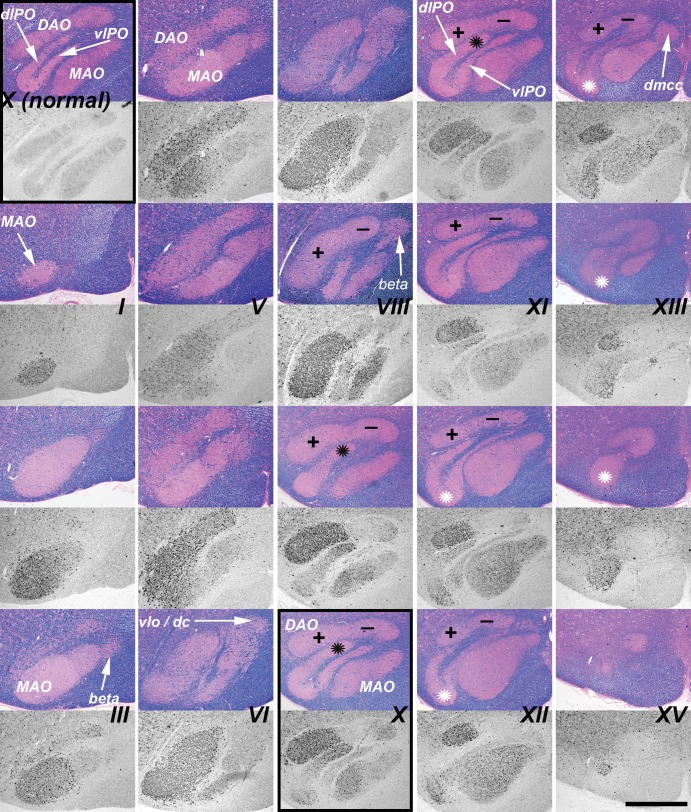
FIGURE 7.
LC3 pathology was found in specific subregions of the inferior olive of the NPC1 cat throughout its caudal-to-rostral extent. This figure is composed of a series of paired iron-Eriochrom cyanine R (EcyR)/eosin (reference in which the entire inferior olive is stained pink), and monochomatic LC3 immunohistochemistry (IHC) images of adjacent tissue sections that are arranged in 5 vertical columns. The series begins caudally at Brodal level I (Supplementary Data Fig. S3) in the first column and continues down the column to level III. The series resumes at the top of column 2, continues down the column to level VI, etc. The series ends rostrally at level XV at the bottom of column 5. The midline of the brain is at the right and ventral at the bottom in all images. Aberrant LC3 accumulation is indicated by the dark punctate IHC staining and is seen throughout most of the MAO. Densely concentrated LC3 pathology in the ventrolateral portion of the DAO is distinguished from the largely unaffected dorsomedial portion by plus and minus symbols on the corresponding reference images. LC3 pathology also localized to both the most medial portion of the dlPO and to the junction region between the vlPO and dlPO indicated by black and white asterisks respectively. The top panel in column 1 (boxed) is from a normal control cat for comparison to an equivalent location in the NPC1 cat at the bottom panel of column 3 (boxed). DAO, dorsal accessory olive; MAO, medial accessory olive; vlPO, principal olive, ventral lamina; dlPO, principal olive, dorsal lamina; vlo/dc, ventral lateral outgrowth/dorsal cap; dmcc, dorsal medial cell column. Scale bar: 1 mm.

