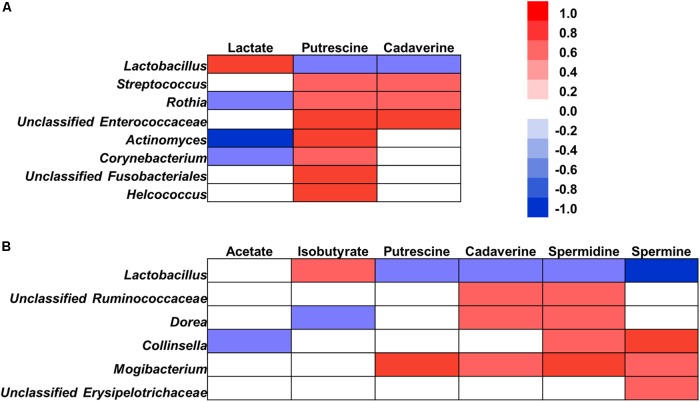
FIGURE 7.
Correlation analysis between the abundance of microbiota (at the genus level) and microbial metabolites in the ileum (A) and cecum (B). Correlation was considered significant when the absolute value of Pearson correlation coefficient was >0.5 and statistically significant (P < 0.05). The red represents a significant positive correlation (P < 0.05), blue represents a significant negative correlation (P < 0.05), and white represents a non-significant correlation (P > 0.05).

