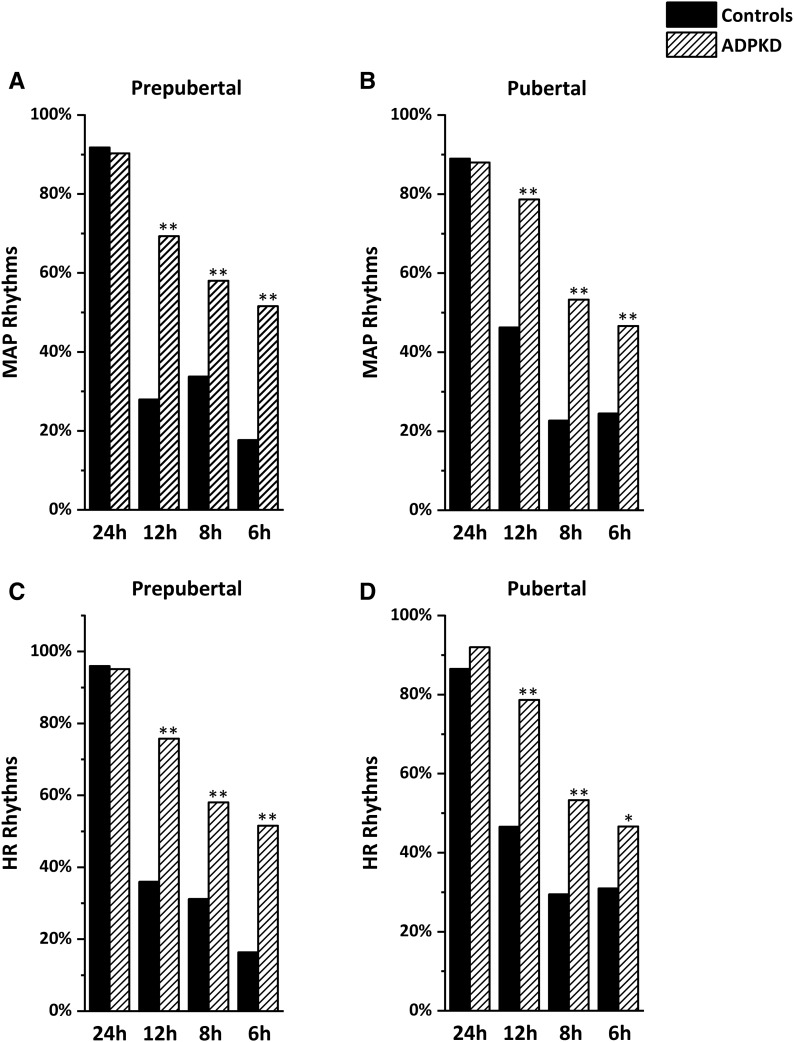
Figure 4.
Prevalence of circadian and ultradian rhythms in 137 participants. The figure shows the prevalence of significant rhythms obtained by partial Fourier analysis on 24-hour mean arterial pressure (MAP; A and B) and heart rate (HR; C and D) data. Data are calculated separately for prepubertal (n=62) and pubertal (n=75) children, and they are compared with control children (22). ADPKD, autosomal dominant polycystic kidney disease. *P<0.01; **P<0.001.

