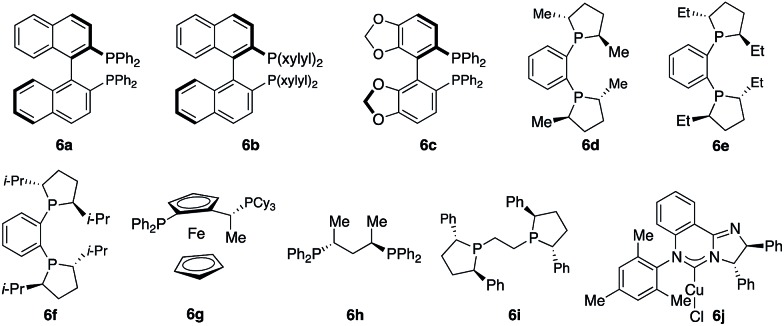
Table 1. Ligand screen a .

| ||||||
| Entry | Ligand | Yield of 3a b (%) | Yield of 5a b (%) | d.r. c | e.r. of 3a d | e.r. of 5a d |
| 1 | 6a | 31 | 31 | 50 : 50 | 83 : 17 | 58 : 42 |
| 2 | 6b | 52 | 37 | 58 : 42 | 64 : 36 | 57 : 43 |
| 3 | 6c | 52 | 41 | 56 : 44 | 92 : 8 | 88 : 12 |
| 4 | 6d | 55 | 22 | 71 : 29 | 36 : 64 | 69 : 31 |
| 5 | 6e | 71 | 24 | 75 : 25 | 30 : 70 | 83 : 17 |
| 6 | 6f | 72 | 27 | 73 : 27 | 64 : 36 | 70 : 30 |
| 7 | 6g | 57 | 43 | 57 : 43 | 30 : 70 | 80 : 20 |
| 8 | 6h | 67 | 22 | 75 : 25 | 92 : 8 | 56 : 44 |
| 9 | 6i | 92 | 7 | 93 : 7 | >99 : 1 | nd e |
| 10 | 6j | 51 | 34 | 60 : 40 | 96 : 4 | 65 : 35 |

| ||||||
aReactions were performed under a N2 atmosphere, see the ESI details.
bYields of purified products.
cd.r. was determined by 400 MHz 1HNMR analysis of unpurified mixtures.
de.r was determined by HPLC analysis of the corresponding diol after oxidation of the organoboron product with NaBO3·4H2O.
eNot determined.
