
Figure 2. Docetaxel-Resistant Cells Are Present in Prostate Cancer Tissue Samples and Associate with Tumor Aggressiveness.
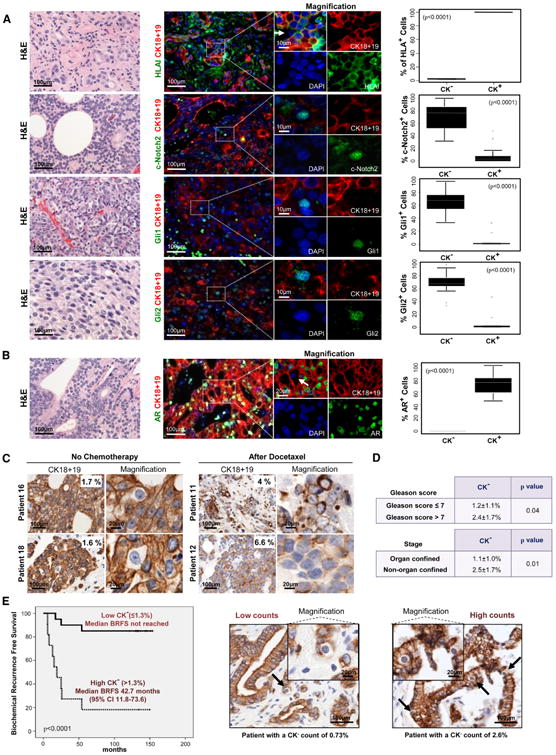
(A and B) Hematoxylin and eosin (H&E) and immunofluorescent staining analyses of prostate cancer metastases for indicated proteins. White arrows point to CK− cells. Corresponding box plots show protein expression in CK− and CK+ cells, including (from top) upper outliers, maximum (excluding outliers), upper quartile, median, lower quartile, minimum (excluding outliers), and lower outliers.
(C) CK18 and CK19 immunohistochemistry of clinical metastatic prostate cancer tissues nontreated and treated with Docetaxel.
(D) Association between the percentage of CK− cells with Gleason Score and pathological stage in primary prostate cancer tissues.
(E) Kaplan-Meier analysis of biochemical recurrence free survival of primary prostate cancer patients (n = 31) with low CK− content (≤1.3%) compared to high CK− content (>1.3%). Representative samples with low and high percentage of CK− cells. Black arrows point to CK− cells. Data is represented as means ± SD. See also Figure S2 and Table S1.