
Figure 3. Docetaxel Exposure Selects for Pre-Existing Resistant Prostate Cancer Cells.
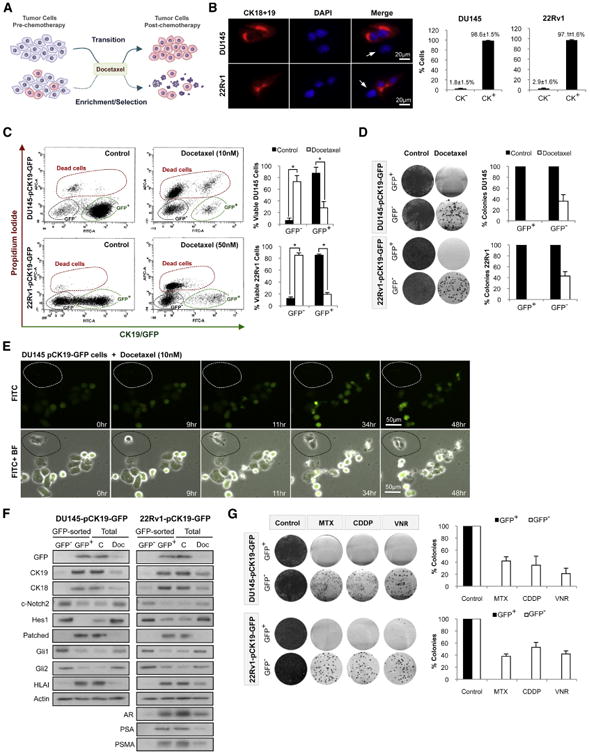
(A) Working hypotheses; transition versus enrichment-selection induced by Docetaxel.
(B) Immunofluorescence and flow cytometry quantification of CK18 and CK19 expression in DU145 and 22Rv1. White arrows point to cells with a CK− phenotype.
(C) Flow cytometry analysis of DU145-pCK19-GFP and 22Rv1-pCK19-GFP treated with Docetaxel (72 hr).
(D) Colony formation assay and quantification of sorted DU145-pCK19-GFP and 22Rv1-pCK19-GFP cells cultured with Docetaxel, 10 and 50 nM respectively, for 72 hr, or DMSO.
(E) Time-lapse microscopy of DU145-pCK19-GFP treated with Docetaxel. Dotted area shows a CK19/GFP− cell.
(F) Immunoblots of GFP and Docetaxel-resistance markers in DU145-pCK19-GFP and 22Rv1-pCK19-GFP sorted cells, as well as in unsorted DU145-pCK19-GFP and 22Rv1-pCK19-GFP cells exposed to Docetaxel (72 hr) at the same concentrations as in (D).
(G) Colony formation assays and quantification of DU145-pCK19-GFP and 22Rv1-pCK19-GFP sorted cells cultured with or without Mitoxantrone 125 and 500 nM, Cisplatin 5 and 2.5 μM, and Vinorelbine 500 and 750 nM, respectively (all 72 hr). Data is represented as means ± SD of triplicate experiments. *p < 0.0001.