
Figure 4.
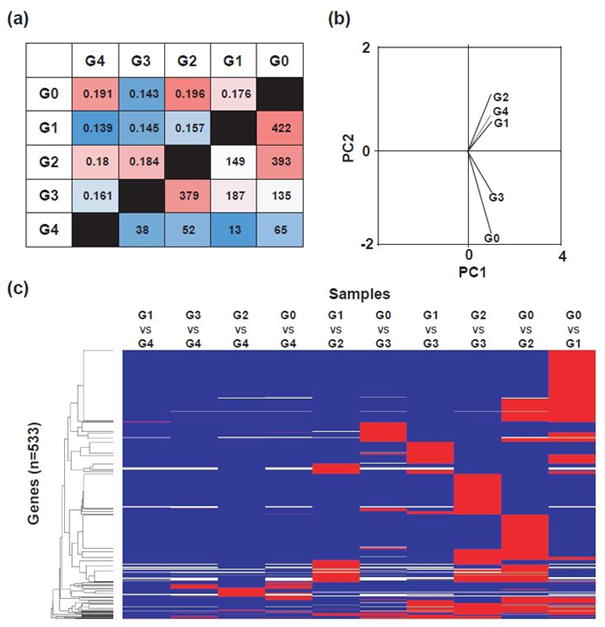
Pairwise comparisons of chondrocyte data by histological grade. (a) Significance matrix highlighting elevated numbers of genes differentially expressed (alpha = 0.05) between groups of chondrocytes from G0 vs G1 & G2 and G2 vs G3 (below diagonal) and J–S distance values (above diagonal). (b) PCA of samples on a set of significant genes. (c) Heat map of 533 significantly different genes among treatment groups (G0–G4). Blue = not significant in this comparison, red = significant in this comparison.