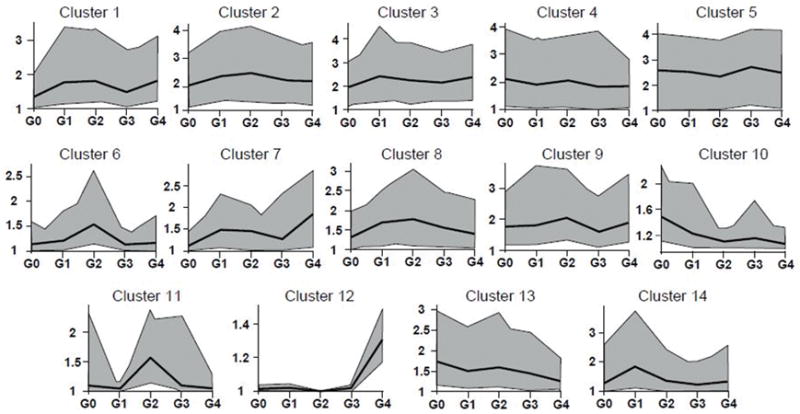
Figure 5.

K-means clustering of samples by Cuffdiff analyses yields 14 clusters of genes differentially expressed between different OA grades. To facilitate the presentation, multiple individual lines from numerous individual genes are simplified into a single gray polygon that encompasses these lines. The general shape of these lines follows the expression average for each grade that is represented by the black line within the polygon.
