
Figure 4. eIF5A regulates translation of ATG3.
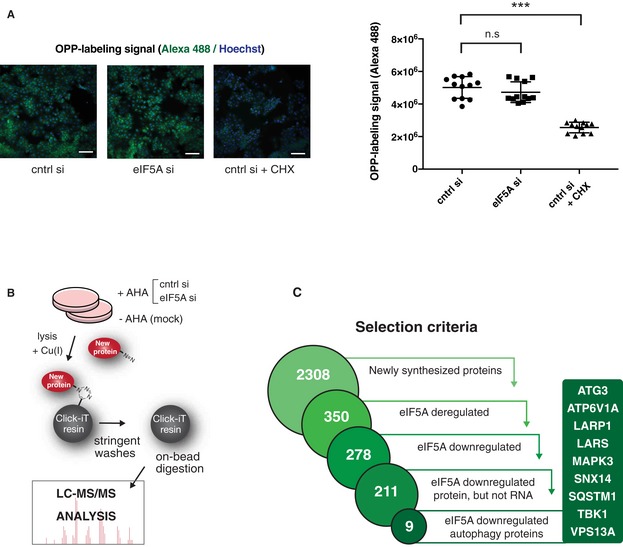
- Global translation measurement upon eIF5A depletion by pulse labelling of newly translated proteins with Alexa Fluor 488‐tagged O‐propargyl‐puromycin (OPP) followed by imaging and fluorescent quantification. MCF‐7 cells were transfected for 72 h, and a positive control was treated with cycloheximide (CHX) for 5 min. Representative images (left) show OPP (green) and Hoechst signals (blue). Quantification (right) shows mean values of fluorescent signal per well from four wells of three combined experiments. Error bars represent SD. Scale bars 100 μm. Student's t‐test: ns P > 0.05, ***P < 0.001.
- Schematic overview of labelling and mass spectrometry‐based analysis of newly translated proteins. Cells were transfected as indicated for 72 h and incubated 2 h with the methionine analogue L‐azidohomoalanine (+AHA) or left untreated (−AHA/mock). The Click‐iT chemistry‐based kit was used for covalent capture of newly synthesized proteins, which were subsequently subjected to LC‐MS analysis. The experiment was performed in biological triplicates.
- Flow diagram illustrating data analysis stages of newly synthesized protein LC‐MS described in (B). A set of newly synthesized proteins was defined using a fivefold enrichment threshold above mock (unlabelled −AHA) sample (2,308 proteins). Further filtering by applying P‐value and fold change thresholds (see Materials and Methods) identified 350 newly synthesized proteins deregulated by eIF5A of which 278 proteins were downregulated upon eIF5A depletion. Comparison to total RNA‐seq data and exclusion of proteins for which mRNA transcripts were deregulated by eIF5A narrowed down this selection to 211 candidates. Merging these with a set of 468 autophagy‐associated genes (geneontology.org) resulted in an overlap of nine autophagy‐related proteins.