
Figure 1.
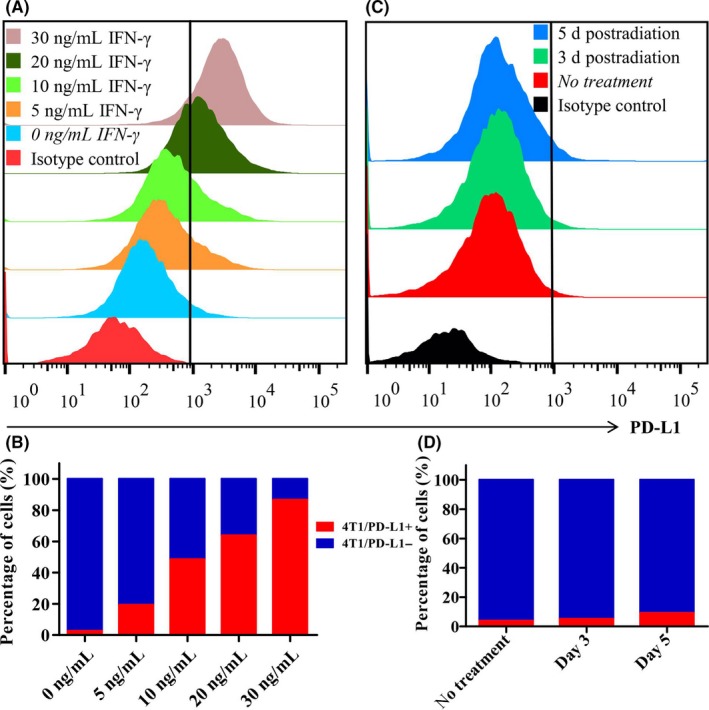
Analysis of programmed death ligand‐1 (PD‐L1) expression on 4T1 cells after receiving radiation or interferon (IFN‐γ) treatment. A,B, Percentage of PD‐L1+ 4T1 cells was assayed by flow cytometry with the presence of different doses of IFN‐γ of 0, 5, 10, 20 and 30 ng/mL. C,D, Percentage of PD‐L1+ 4T1 cell was assessed on days 3 and 5 after receiving 10 Gy radiation