
Figure 1.
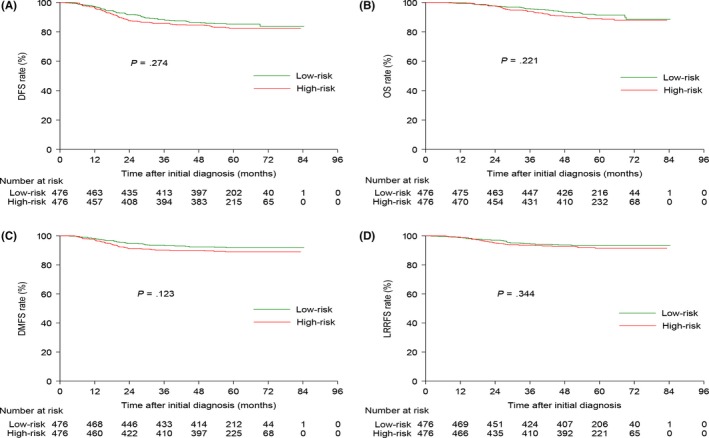
Kaplan–Meier DFS (A), OS (B), DMFS (C) and LRRFS (D) curves for the 476 pairs of patients stratified as low risk (NRS2002 <3) and high risk (NRS2002 ≥ 3) using the NRS2002 scale. DFS, disease‐free survival; DMFS, distant metastasis‐free survival; LRRFS, locoregional relapse‐free survival; NRS, nutritional risk screening; OS, overall survival