
Figure 7. TRAF suppression by catalytically inactive LGP2.
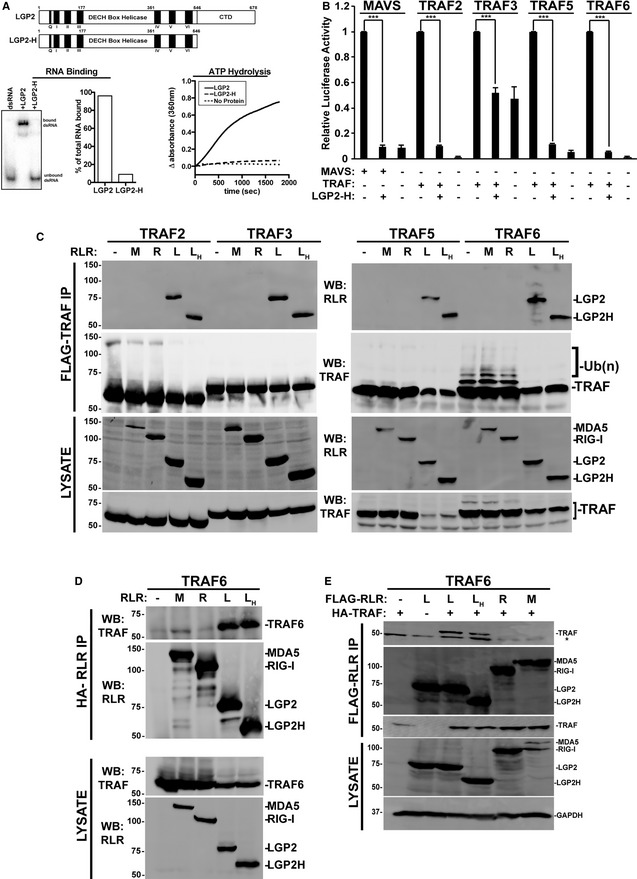
- Diagram illustrating the domain structure of full‐length LGP2 and LGP2‐H (top). Analysis of LGP2‐H catalytic properties. RNA binding was tested by mobility shift assay and quantified by phosphor imaging (bottom left). ATP hydrolysis was directly measured for both proteins at 100 nM (bottom right).
- NFκB‐reporter gene assay with MAVS or indicated TRAFs expressed with or without LGP2‐H. Cells were harvested 24 h post‐transfection prior to luciferase assays. Bars represent normalized mean values (n = 3) ± standard deviation. ***P ≤ 0.0005 by two‐tailed Student's t‐test. Corresponding immunoblots in Fig EV1.
- Cells were transfected with plasmids expressing HA‐tagged MDA5 (M), RIG‐I (R), LGP2 (L), LGP2‐H (LH) and FLAG‐tagged TRAF2, 3, 5, and 6 as indicated (n = 3). Cell lysates were subjected to FLAG immunoaffinity purification and immunoblotting with antisera for FLAG (TRAF) and HA (LGP2).
- Reverse co‐immunoprecipitation. Similar to (C), except cell lysates were subjected to HA immunoprecipitation and immunoblotting with antisera for FLAG (TRAF6) and HA (LGP2).
- Reverse co‐immunoprecipitation. Similar to (C), except cells were transfected with plasmids expressing HA‐tagged TRAF6 and FLAG‐tagged RLRs as indicated. Cell lysates were subjected to FLAG immunoaffinity purification and immunoblotting with antisera for FLAG (RLR) and HA (TRAF6) (n = 3). Asterisk (*) indicates non‐specific cross‐reactivity.
Source data are available online for this figure.