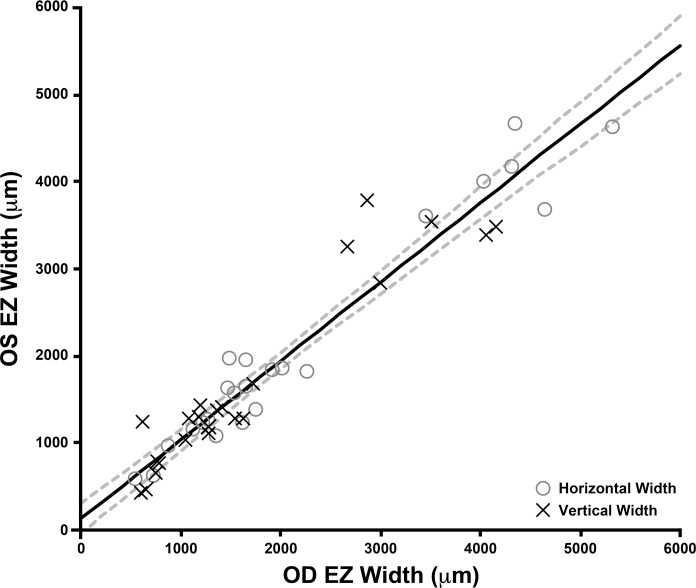
Figure 2.
Interocular comparison of EZ width illustrating symmetry between EZ width measurements of left (OS) and right eyes (OD). HW measurements are represented by gray open circles, while VW measurements are represented by crosses. The trend line for all EZ width measurements has a slope of 0.907 (solid line), and the dashed lines show the 95% CIs for the linear regression. No significant difference was observed between OD and OS measurements (see text).

