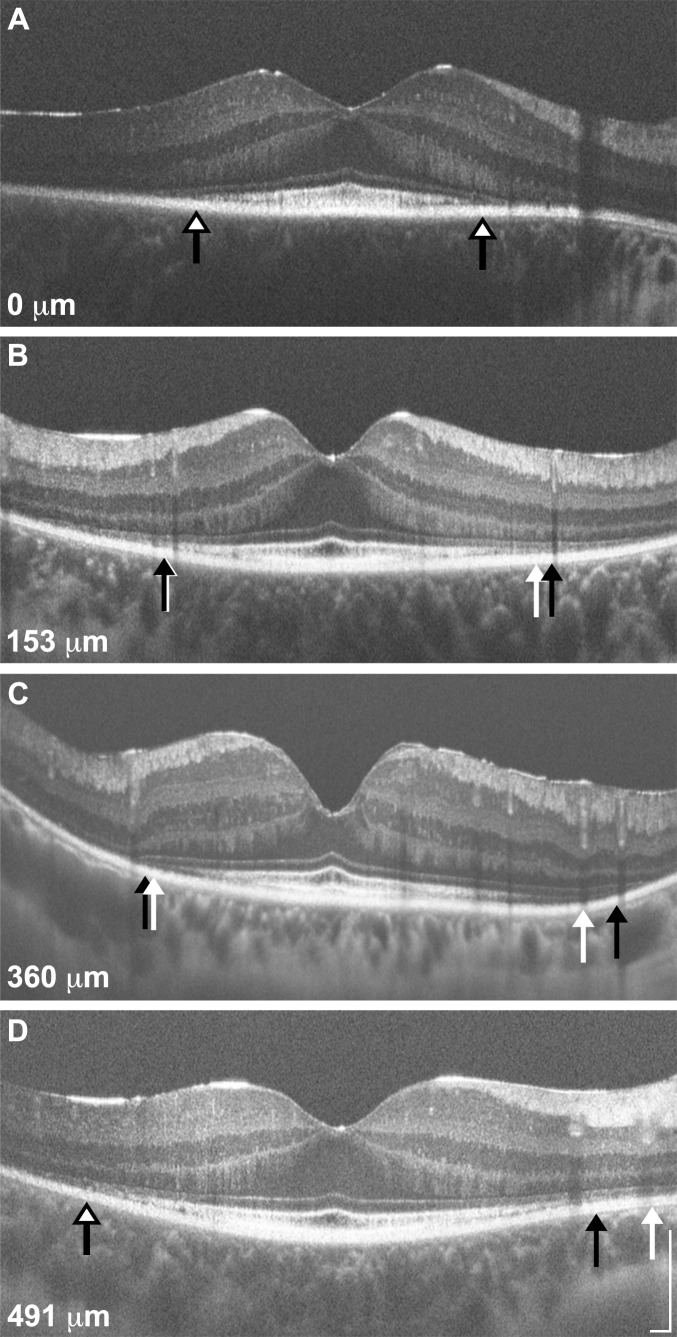
Figure 5.
Variable repeatability of EZ width measurements. Shown are four SD-OCT line scans (A, D: horizontal; B, C: vertical) representing the range of differences observed (0–491 μm). The EZ boundaries from measurement 1 are represented by white arrows, while those from measurement 2 are represented by black arrows; in cases where there was no difference between the EZ boundaries, a single white arrow with a black border is shown. Panel (A) is from a 28-year-old female (KS_10084) with Usher type II (USH2A; p.C3281F, p.C1195F, p.T5006M), panels (B, D) are from a 19-year-old female (KS_10243) with ADRP (RP1; p.R677X), and panel (C) is from a 55-year-old female (JC_1088) with Usher type III (GPR98; p.C5921R, p.L5999P). The absolute difference in EZ width is provided for each scan. Scale bars = 200 μm.

