
Figure 6.
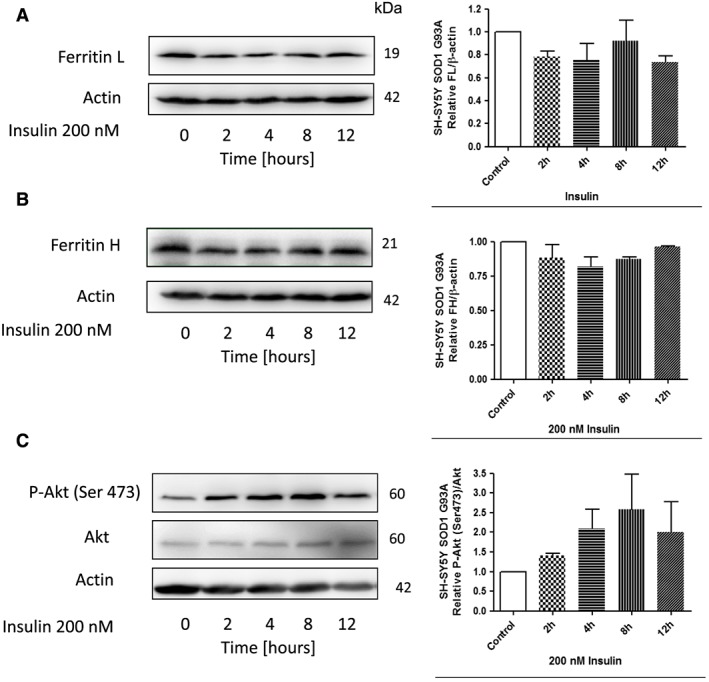
Insulin treatment down‐regulate ferritin proteins in SH‐SY5Y cells expressing G93A SOD1. Representative immunoblot for (A) ferritin L, (B) ferritin H, (C) Akt and P‐Akt (Ser473) of stable cell line SH‐SY5Y expressing G93A SOD1 following treatment with or without 200 nM insulin for the indicated time periods. Changes in all presented protein densitometry levels were normalized against β‐actin. Experiments were performed at least three independent times, yielding comparable results. Bar graphs on the right panel of the figure present a change in protein levels as the mean ± SEM of three independent experiments, relative to control.