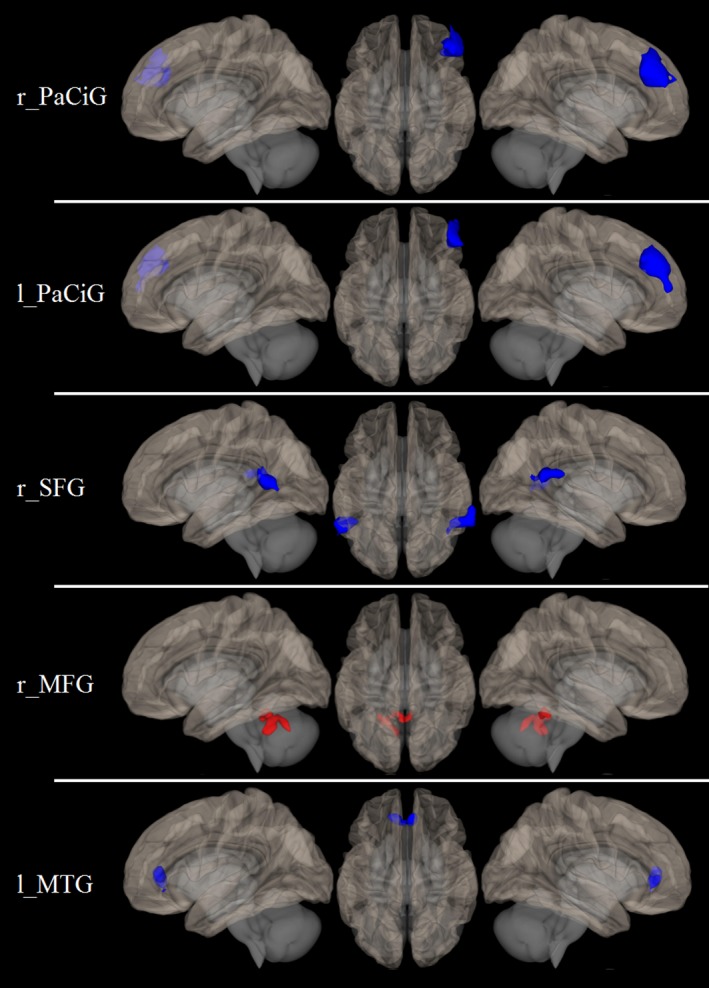
Figure 1.

Results of the between‐group RS‐fMRI analysis. Brain regions showing a different functional connectivity between FRDA patients and healthy controls, superimposed on the left lateral (left), right lateral (right), and upper (central column) view of a three‐dimensional rendering of a healthy brain in the MNI space. Areas of increased connectivity in patients compared to controls are shown in blue, while areas of reduced connectivity are shown in red. RS‐fMRI, resting‐state functional MRI; FRDA, Friedreich's Ataxia; MNI, Montreal Neurological Institute; r_PaCiG, right paracingulate gyrus; l_PaCiG, left paracingulate gyrus; r_SFG, right superior frontal gyrus; r_MFG, right medial frontal gyrus; l_MTG, left middle temporal gyrus.
