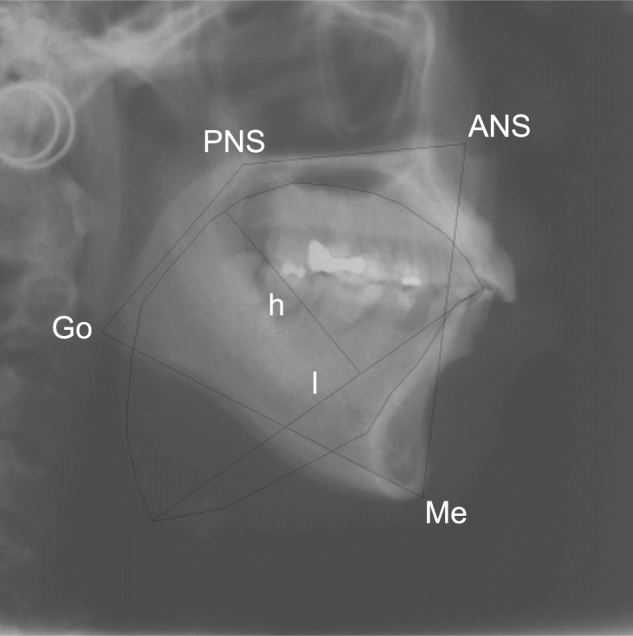
Figure 3.

Lateral cephalogram showing the trace of the outline of the tongue of which cross-sectional area (CSA) was determined. Tongue height and length also are marked. The oral enclosure box, the sides of which are lines drawn between the points PNS, ANS, Me, and Go, is shown. A ratio of the CSA of the tongue and oral enclosure area was calculated. h = tongue height; l = tongue length; PNS = posterior nasal spine. See Figure 2 legend for expansion of other abbreviations.
