
Figure 7.
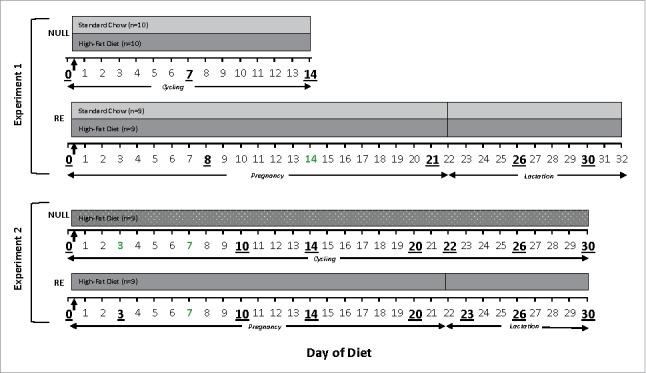
Research design for experiments 1 and 2. The horizontal axis shows the time scale, where Day 0 is the day the animals in the HF groups were switched to HF diet. The same time scale is used throughout the text. Days underlined and larger are the approximate times that fecal samples were obtained. Vertical arrows indicate when the HF diet group was placed on the diet. Null: nulliparous, cycling females; RE: reproductively experienced females.