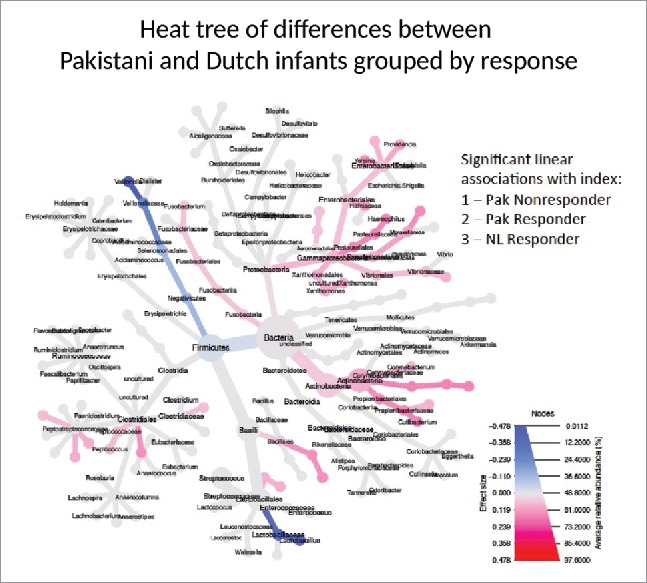
Figure 3.

Phylogenetic Heat Tree illustrates the differences in relative bacterial abundance between all Pakistani non-responder, Pakistani responder and Dutch infants when indexed by response. Each group's RVV response is indexed (Pakistani non-responder 1, responder 2, and Dutch infants 3) and those bacteria with significant linear associations with index are colored. Colored blue are bacteria where a lower abundance associates with RVV response and colored red are bacterial groups where a higher abundance correlates with RVV response.
