Abstract
We previously used RNA sequencing to establish the microRNA (miRNA) expression signature of pancreatic ductal adenocarcinoma (PDAC). We found that both strands of pre‐miR‐148a (miR‐148a‐5p: the passenger strand and miR‐148a‐3p: the guide strand) were downregulated in cancer tissues. Ectopic expression of miR‐148a‐5p and miR‐148a‐3p significantly inhibited cancer cell migration and invasion, indicating that both strands of pre‐miR‐148a had tumor‐suppressive roles in PDAC cells. In silico database and genome‐wide gene expression analyses identified a total of 15 genes that were putative targets regulated by these miRNAs. High expression of miR‐148a‐5p targets (PHLDA2,LPCAT2 and AP1S3) and miR‐148a‐3p targets (SMA, ENDOD1 and UHMK1) was associated with poor prognosis of patients with PDAC. Moreover, knockdown of PHLDA2 expression inhibited cancer cell aggressiveness, suggesting PHLDA2 acted as an oncogene in PDAC cells. Involvement of the passenger strand of pre‐miR‐148a (miR‐148‐5p) is a new concept in cancer research. Novel approaches that identify tumor‐suppressive miRNA regulatory networks in lethal PDAC might provide new prognostic markers and therapeutic targets for this disease.
Keywords: cancer genome/genetics, characteristics and pathology of human cancer, information, invasion and metastasis, oncogenes and tumor‐suppressor genes
1. INTRODUCTION
Pancreatic ductal adenocarcinoma (PDAC) is one of the most lethal cancers known to medicine. The 5‐year survival period of patients with PDAC is approximately 5%.1 At first diagnosis, most patients with PDAC have local invasion or distant metastasis, and only about 15% of patients are candidates for surgical resection.2 Currently developed combination chemotherapies have a limited therapeutic impact on patients with advanced stage disease.3 Therefore, improved understanding of the underlying pathological mechanisms could lead to new therapeutic approaches for this disease.
In recent years, microRNA (miRNA) has received considerable attention as a crucial molecule that controls the expression of protein‐coding or non‐coding genes. Regulation is achieved by translational repression or mRNA cleavage in a sequence‐specific method.4 Currently developed bioinformatics approaches indicate that 1 miRNA can regulate thousands of mRNAs and, conversely, most protein‐coding genes in the genome are under the control of miRNAs.5 Therefore, aberrantly expressed miRNAs can disturb entire networks of mRNAs and proteins.
Identification of dysregulated miRNAs in cancer cells is an important first step in elucidating aberrantly expressed genes and proteins in cancer. Based on this background, our groups have been comprehensively studying specimens of several cancers by genome‐wide miRNA expression analyses.6, 7 Analyses of miRNA expression signatures of PDAC clinical specimens by RNA sequencing showed that some passenger strands of miRNAs (eg, miR‐216a‐3p, miR‐216b‐3p, miR‐148a‐5p, miR‐129‐1‐3p and miR‐129‐2‐3p) were significantly downregulated in cancer tissues.8 In miRNA biogenesis, it is generally believed that 1 strand of the mature duplex miRNA (the guide strand) is incorporated into the miRNA‐induced silencing complex (RISC) and its control target genes by RNA degradation and translational repression.9 In contrast to the guide strand, the passenger strand of miRNA was previously thought to be degraded and to have no function.10, 11
Contrary to established beliefs, our recent studies indicated that several passenger strands of miRNAs acted as antitumor miRNAs in several cancers.12, 13 For example, miR‐145‐3p (passenger strand) was significantly downregulated in castration‐resistant prostate cancer and restoration of miR‐145‐3p inhibited cancer cell migration and invasion through targeting of MELK, NCAPG, BUB1, and CDK1.14 Similarly, antitumor functions have also been shown in bladder cancer and lung cancer.15, 16 Realization that the passenger strand of miRNA is involved in the regulation of RNA networks will improve our understanding of cancer cell development and tumor progression.
In the present study, our goal was to identify novel therapeutic targets in lethal PDAC. Based on our original miRNA expression signature of PDAC, we focused on pre‐miR‐148a (miR‐148a‐5p [passenger strand] and miR‐148a‐3p [guide strand]) and investigated the functional significance of these miRNAs and their regulatory RNA networks in PDAC cells. Elucidation of molecular networks modulated by novel antitumor miRNAs in PDAC cells may provide new insights into the pathological mechanisms underlying the disease.
2. MATERIALS AND METHODS
2.1. Clinical specimens and cell lines
Clinical tissue specimens (n = 30) were obtained from patients with PDAC who underwent curative surgical resection at Kagoshima University Hospital between 1997 and 2016. Normal pancreatic tissue specimens (n = 18) were obtained from non‐cancerous tumor‐adjacent tissues. Each surgical specimen was histologically characterized according to the TNM classification system.17 All patients in this study provided informed consent and the study protocol was approved by the Institutional Review Board of Kagoshima University. Quantitative real‐time PCR (qRT‐PCR) of clinical samples was carried out by extracted total RNA from frozen specimens, immunohistochemistry was performed by PDAC tissues from formalin‐fixed paraffin‐embedded. Two human PDAC cell lines (PANC‐1 and SW1990) were used in this study as described previously.8, 18, 19
2.2. Quantitative real‐time PCR
Protocols for total RNA extraction from clinical specimens and cell lines were described in previous studies. The procedure for quantification of miRNAs and mRNAs was described earlier.18, 19, 20, 21 TaqMan qRT‐PCR probes and primers were obtained from Thermo Fisher Scientific (Waltham, MA, USA) as follows: miR‐148a‐5p (product ID: 002134); miR‐148a‐3p (product ID: 000470); PHLDA2(product ID: Hs00169368_m1); LPCAT2 (product ID: Hs01044164_m1); AP1S3 (product ID: Hs00950999_m1); SMS (product ID: Hs01924834_u1); ENDOD1 (product ID: Hs00826684_m1); UHMK1 (product ID: Hs00332674_m1). Human GUSB (product ID: Hs99999908_m1), RNU48 (product ID: 001006), miR‐26a (product ID: 000405), miR‐21 (product ID: 000397) were used as internal controls.
2.3. Transfection of miRNA mimic, siRNA and cDNA cloning into PDAC cell lines
The procedure for miRNA, siRNA and cDNA plasmid transfection into cancer cells was described previously.18, 19, 20, 21 Pre‐miR™ miRNA precursors for miR‐148a‐5p (product ID: PM 12683), miR‐148a‐3p (product ID: PM 10263), negative control miRNA (product ID: AM 17010), 2 PHLDA2 siRNAs (product IDs: HSS144353 and HSS144354) and negative control siRNA (product ID: D‐001810‐10) were purchased from Thermo Fisher. A Flexi HaloTag cDNA clone of PHLDA2 (Vector: pFN21A, Product ID: FHC02241) was purchased from Kazusa Genome Technologies (Chiba, Japan). Transfection efficiencies of miRNA and siRNA in cell lines were calculated as described.22
2.4. Cell proliferation, migration and invasion assays
Protocols for functional assays (cell proliferation, migration and invasion) were described previously.18, 19, 20, 21
2.5. Argonaute 2(Ago2)‐bound miRNA isolation by immunoprecipitation
PANC‐1 and SW1990 cells growing on 6‐well plates were transfected with 10 nmol/L pre‐miR‐148a. After reverse transfection, immunoprecipitation was carried out using a microRNA Isolation kit, Human Ago2 (Wako, Osaka, Japan). The procedure was as described previously.13, 14
2.6. Western blot analyses and immunohistochemistry
Antibodies against PHLDA2 (product ID: ab99209; Abcam, Tokyo, Japan), poly (ADP‐ribose) polymerase (PARP) antibody (product ID: 9542; Cell Signaling Technology, Danvers, MA, USA) and GAPDH (product ID: SAF6698; Wako) were used in this study. The procedures for western blotting and tissue immunohistochemistry were as described previously.18, 19, 23
2.7. Genome‐wide gene expression and in silico analyses
To identify genes targeted by miR‐148a‐5p and miR‐148a‐3p, we used a combination of in silico analyses and genome‐wide gene expression analyses as described previously.18, 19, 23 Expression data by microarray analyses were deposited into the Gene Expression Omnibus (GEO) database (accession numbers GSE15471, GSE93290).
2.8. The Cancer Genome Atlas (TCGA) database analysis of PDAC specimens
The clinical significance of the expression of miRNAs or target genes and relation to PDAC pathogenesis were determined with the OncoLnc database (http://www.oncolnc.org).18, 24, 25 Clinical information on 174 PDAC samples was obtained from National Cancer Institute GDC Data Portal (https://portal.gdc.cancer.gov) and cBioPortal (http://www.cbioportal.org). TNM stage, T stage, N stage and M stage on TCGA pathological database were evaluated by The American Joint Committee on Cancer (AJCC). Disease‐free survival (DFS) within 3 years and recurrence were analyzed in 113 PDAC samples where data were disclosed.
2.9. Plasmid construction and dual‐luciferase reporter assay
The vector used for dual‐luciferase reporter assay was psiCHECK‐2 vector (C8021; Promega, Madison, WI, USA). The cloned sequences are listed in Figure S1. The procedure for dual‐luciferase reporter assay was described previously.18, 19, 20, 21
2.10. Identification of downstream targets regulated by PHLDA2 in PDAC
Genome‐wide microarray analysis was applied for identification of PHLDA2 downstream targets. Expression data were deposited in the GEO database (GSE106791). Genes downregulated by PHLDA2 were assessed for PDAC prognosis using TCGA database.
2.11. Statistical analysis
Relationships between 2 groups and expression values obtained by qRT‐PCR were analyzed using the Mann‐Whitney U test. Correlation between expression of miR‐148a‐5p, miR‐148a‐3p and PHLDA2 was evaluated using Spearman's rank test. Relationships among more than 3 variables and numerical values were analyzed using the Bonferroni‐adjusted Mann‐Whitney U test. Overall survival (OS) and DFS after surgery were gauged using Kaplan–Meier curves. Patients were divided into 2 groups based on high and low gene expression around the median, and differences in survival were estimated using the log‐rank test. We used Expert StatView software (version 5.0; SAS Institute Inc., Cary, NC, USA) for these analyses.18, 19
3. RESULTS
3.1. Expression levels of miR‐148a‐5p and miR‐148a‐3p in PDAC specimens and cell lines
Expression levels of miR‐148a‐5p and miR‐148a‐3p in PDAC tissues (n = 30), normal pancreatic tissues (n = 18) and 2 PDAC cell lines (PANC‐1 and SW1990) were evaluated. Characteristics of the clinical samples are summarized in Tables 1, 2 . Expression levels of miR‐148a‐5p and miR‐148a‐3p were significantly lower in tumor tissues compared with normal pancreatic tissues (P < .0001 and P = .0004, respectively, Figure 1A). Spearman's rank test showed positive correlations between the expression of miR‐148a‐5p and miR‐148a‐3p (R = .669 and P < .0001; Figure 1B). However, there were no significant relationships between any of the clinical features (ie, neoadjuvant chemotherapy, metastasis or recurrence) and the expression of miR‐148a‐5p and miR‐148a‐3p (data not shown).
Table 1.
Characteristics of patients in the present study: pancreatic ductal adenocarcinoma
| Total no. | 30 |
| Average age (range) years | 65.4 (42‐85) |
| Gender (%) | |
| Male | 14 (46.7) |
| Female | 16 (53.3) |
| T category (%) | |
| pTis | 1 (3.3) |
| pT1 | 10 (33.3) |
| pT2 | 13 (43.3) |
| pT3 | 4 (13.3) |
| pT4 | 2 (6.7) |
| N category (%) | |
| 0 | 17 (56.7) |
| 1 | 13 (43.3) |
| M category (%) | |
| 0 | 28 (93.3) |
| 1 | 2 (6.7) |
| Neoadjuvant chemotherapy (%) | |
| (−) | 12 (40.0) |
| (+) | 18 (60.0) |
| Recurrence (%) | |
| (−) | 13 (43.3) |
| (+) | 17 (56.7) |
Table 2.
Characteristics of patients in the present study: normal pancreatic tissue
| Total no. | 18 |
| Average age (range) years | 65.9 (42‐85) |
| Gender (%) | |
| Male | 7 (38.9) |
| Female | 11 (61.1) |
Figure 1.
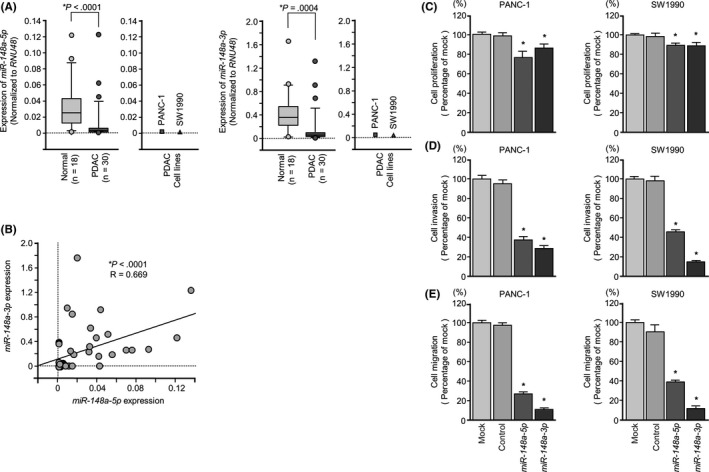
Antitumor functions of pre‐miR‐148a in pancreatic ductal adenocarcinoma (PDAC) cell lines (PANC‐1 and SW1990). A, Expression levels of miR‐148a‐5p and miR‐148a‐3p in PDAC clinical specimens and cell lines were determined by qRT‐PCR. Data were normalized to RNU48 expression. B, Expression levels of miR‐148a‐3p and miR‐148‐5p were positively correlated (R = .699, P < .0001). C, Cell proliferation was determined by XTT assays 72 h after transfection with 10 nmol/L miR‐148a‐5p or miR‐148a‐3p, *P < .0001. D, Cell invasion activity was determined using Matrigel invasion assays, *P < .0001. E, Cell migration activity was determined by migration assays, *P < .0001
3.2. Both miR‐148a‐5p and miR‐148a‐3p bound to Ago2
To investigate whether the miR‐148a‐5p (passenger strand) is incorporated into RISC, we carried out immunoprecipitation with antibodies targeting Ago2. After transfection with miR‐148a‐5p or miR‐148a‐3p, Ago2‐bound miRNAs were isolated, and qRT‐PCR was carried out to determine whether miR‐148a‐5p or miR‐148a‐3p was bound to Ago2 (Figure S2A,B).
After transfection of PANC‐1 and SW1990 cells with miR‐148a‐5p and immunoprecipitation by anti‐Ago2 antibodies, miR‐148a‐5p levels were significantly higher than those of mock or control transfected cells and those of miR‐148a‐3p‐transfected cells (Figure S2C, middle). Similarly, after miR‐148a‐3p transfection, miR‐148a‐3p levels were significantly higher than those of mock or control transfected cells and those of miR‐148a‐5p transfected cells (Figure S2C, lower). This suggests that miR‐148a‐5p was incorporated into RISC when miR‐148a‐5p was transfected, miR‐148a‐3p was incorporated into RISC when miR‐148a‐3p was transfected, and pre‐miR‐148a acts on cell lines separately to miR‐148a‐5p and miR‐148a‐3p. miR‐21 was used as an internal control of microRNA level expression between each sample (Figure S2C, upper).
3.3. DNA methylation and miR‐148a expression levels
Expression levels of miR‐148a‐5p and miR‐148a‐3p were markedly lower in the 2 cell lines (Figure 1A). To elucidate the molecular mechanisms underlying the low expression of miR‐148a‐5p and miR‐148a‐3p in PDAC cells, the PANC‐1 cell line was treated with a demethylating agent (5‐aza‐2′‐deoxycytidine [5‐aza‐dC]). Expression levels of miR‐148a‐5p and miR‐148a‐3p in PANC‐1 cells were significantly elevated by 5‐aza‐dC treatment (Figure S3B). These data suggested that DNA methylation might cause silencing of miR‐148a‐5p and miR‐148a‐3p in PDAC cells.
3.4. Effects of miR‐148a‐5p and miR‐148a‐3p expression on cell growth, apoptosis, migration and invasiveness of PDAC cell lines
Gain‐of‐function studies were carried out to investigate the functional roles of miR‐148a‐5p and miR‐148a‐3p. XTT assays showed significant inhibition of cell proliferation in PANC‐1 or in SW1990 cells transfected with miR‐148a‐5p or miR‐148a‐3p in comparison with mock or control transfectants (P < .0001, Figure 1C). Apoptotic cell numbers (early apoptotic and late apoptotic cells) were significantly larger in miR‐148a‐5p or miR‐145‐3p transfectants than in mock or negative control transfectants (Figure S4A,B). Western blot analyses showed that cleaved PARP expression was significantly increased in miR‐148a‐5p or miR‐148a‐3p transfectants compared with mock or negative control transfectants (Figure S4C). In vitro assays showed that migration and invasion were significantly inhibited in miR‐148a‐5p or miR‐148a‐3p transfectants compared with mock or miR‐control transfectants (each P < .0001, Figure 1D,E). These results suggested that pre‐miR‐148a could have an antitumor function in PDAC cells.
3.5. Identification of candidate genes regulated by miR‐148a‐5p and miR‐148‐3p in PDAC cells
Next, we attempted to identify target genes coordinately regulated by miR‐148‐5p and miR‐148a‐3p. The strategies for narrowing down the genes targeted by miR‐148a‐5p and miR‐148a‐3p are shown in Figure 2. We carried out a combination of in silico analysis, GEO analysis and genome‐wide gene expression analysis using PDAC cell lines (PANC‐1 and SW1990) transfected with miR‐148a‐5p or miR‐148a‐3p (GEO accession number GSE93290).
Figure 2.
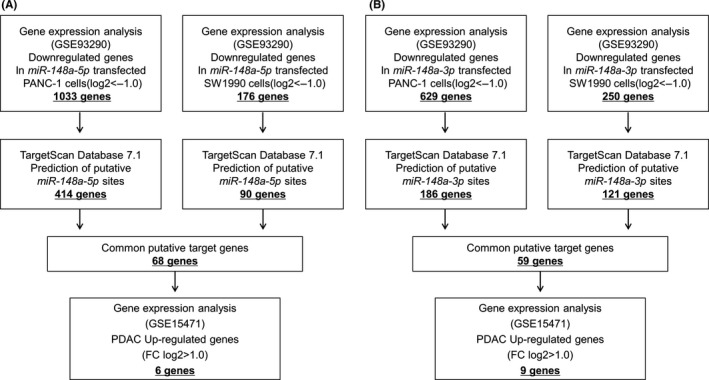
Strategy for analysis of pre‐miR‐148a candidate target genes. Strategy for identification of putative candidate genes regulated by (A) miR‐148a‐5p and (B) miR‐148a‐3p in pancreatic ductal adenocarcinoma (PDAC) cells. Approach to identifying miR‐148a‐5p and miR‐148a‐3p target genes. We used in silico analysis of genome‐wide gene expression, TargetScan and Gene Expression Omnibus (GEO) database analysis of miR‐148a‐5p and miR‐148a‐3p transfected PANC‐1 and SW1990 cells
In PANC‐1 and SW1990 cells transfected with miR‐148a‐5p, a total of 1033 and 176 genes, respectively, were downregulated. Furthermore, the TargetScan database showed that 414 and 90 of those genes, respectively, had putative target sites for miR‐148a‐5p in their 3′‐UTR. We found that there were 68 common genes targeted in both cell lines. Last, gene expression data showed that 6 of those genes were upregulated (fold‐change log2 > 1.0) in cancer tissues according to GEO database analyses (GEO accession number GSE15471).
In miR‐148a‐3p transfectants, a total of 629 and 250 genes, respectively, were downregulated in PANC‐1 and SW1990. Furthermore, the TargetScan database showed that 186 and 121 genes, respectively, had putative target sites for miR‐148a‐3p in their 3′‐UTR. We found that there were 59 common genes targeted in both cell lines. Last, 9 genes were upregulated (fold‐change log2 > 1.0) in cancer tissues by GEO database analyses (GEO accession number GSE15471).
We also checked the clinical significance of 6 genes targeted by miR‐148a‐5p (Table 3) and 9 genes targeted by miR‐148a‐3p (Table 4). Kaplan‐Meier survival curves showed that high expression of all 6 of the genes was associated with poor prognoses in PDAC in the TCGA database. Target genes of miR‐148a‐5p included PHLDA2, LPCAT2 and AP1S3, whereas target genes of miR‐148a‐3p included SMS, ENDOD1 and UHMK1 where mRNA expression levels were significantly upregulated. On TCGA database, patients showing elevated expression of all 6 target genes had a significantly poorer overall survival by Kaplan‐Meier analysis (Figure 3). Furthermore, high expression of target genes tended to indicate recurrence and DFS was shorter (Figure 3). Next, we validated PDAC and normal pancreatic tissue in our specimens, and carried out qRT‐PCR analysis of each target gene's mRNA expression level. PHLDA2, LPCAT2, AP1S3, ENDOD1 and UHMK1 showed significantly high expression in PDAC (Figure 4, left panels). In addition, we carried out qRT‐PCR analysis of each target gene's mRNA expression level using RNA from PANC‐1 and SW1990 cells that had been transfected with miR‐148a‐5p mimic or miR‐148a‐3p mimic. The data showed that each target gene's expression was downregulated (Figure 4, right panels).
Table 3.
Candidate target genes regulated by miR‐148a‐5p
| Entrez gene ID | Gene symbol | Gene name | miR‐148a‐5p | Expression in miR‐148a‐5p transfectants FC(log2) | GEO data (GSE15471) | aTCGA_OncoLnc P‐value | |
|---|---|---|---|---|---|---|---|
| Target sites | PANC1 | SW1990 | FC(log2) | ||||
| 7262 | PHLDA2 | Pleckstrin homology‐like domain, family A, member 2 | 1 | −2.343 | −1.560 | 2.847 | .0361 |
| 11167 | FSTL1 | Follistatin‐like 1 | 1 | −1.307 | −1.433 | 1.841 | .2790 |
| 54947 | LPCAT2 | Lysophosphatidylcholine acyltransferase 2 | 4 | −1.385 | −1.458 | 1.474 | .0039 |
| 23531 | MMD | Monocyte to macrophage differentiation‐associated | 1 | −1.816 | −1.030 | 1.414 | .6490 |
| 1808 | DPYSL2 | Dihydropyrimidinase‐like 2 | 1 | −2.039 | −2.620 | 1.288 | .9210 |
| 130340 | AP1S3 | Adaptor‐related protein complex 1, sigma 3 subunit | 2 | −1.117 | −1.313 | 1.166 | .0041 |
GEO, Gene Expression Omnibus; TCGA, The Cancer Genome Atlas.
Kaplan‐Meier analysis log‐rank P‐value <.05, poor prognosis with a high expression.
Table 4.
Candidate target genes regulated by miR‐148a‐3p
| Entrez gene ID | Gene symbol | Gene name | miR‐148a‐3p | Expression in miR‐148a‐5p transfectants FC(log2) | GEO data (GSE15471) | aTCGA_OncoLnc P‐value | |
|---|---|---|---|---|---|---|---|
| Target sites | PANC1 | SW1990 | FC(log2) | ||||
| 3106 | HLA‐B | Major histocompatibility complex, class I, B | 1 | −1.333 | −1.418 | 1.411 | .7440 |
| 8829 | NRP1 | Neuropilin 1 | 2 | −2.024 | −1.411 | 1.302 | .9850 |
| 6611 | SMS | Spermine synthase | 1 | −1.447 | −1.650 | 1.263 | .0032 |
| 54492 | NEURL1B | Neuralized homolog 1B (Drosophila) | 1 | −1.438 | −1.528 | 1.236 | .1540 |
| 3134 | HLA‐F | Major histocompatibility complex, class I, F | 1 | −1.401 | −1.176 | 1.216 | .2220 |
| 3105 | HLA‐A | Major histocompatibility complex, class I, A | 2 | −1.544 | −1.713 | 1.187 | .7310 |
| 23052 | ENDOD1 | Endonuclease domain containing 1 | 2 | −1.135 | −1.500 | 1.177 | .0003 |
| 5476 | CTSA | Cathepsin A | 1 | −1.747 | −1.704 | 1.078 | .2780 |
| 127933 | UHMK1 | U2AF homology motif (UHM) kinase 1 | 3 | −1.583 | −1.085 | 1.029 | .0131 |
GEO, Gene Expression Omnibus; TCGA, The Cancer Genome Atlas.
Kaplan‐Meier analysis log‐rank P‐value <.05, poor prognosis with a high expression.
Figure 3.
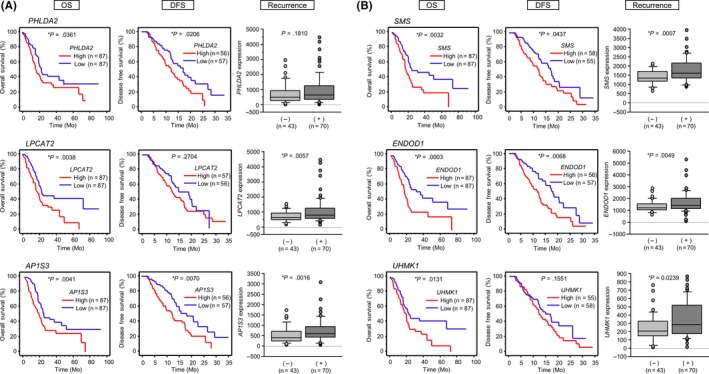
Overall survival, disease‐free survival and recurrence of target genes by miR‐148a‐5p and miR‐148a‐3p on The Cancer Genome Atlas (TCGA) database. A, Three candidate genes modulated by miR‐148a‐5p (PHLDA2, LPCAT2, AP1S3). Kaplan‐Meier analysis and the prognostic factors for pancreatic ductal adenocarcinoma (PDAC) are shown, *P < .05. B, Three candidate genes modulated by miR‐148a‐3p (SMS, ENDOD1, UHMK1). Kaplan‐Meier analysis and the prognostic factors for PDAC are shown, *P < .05
Figure 4.
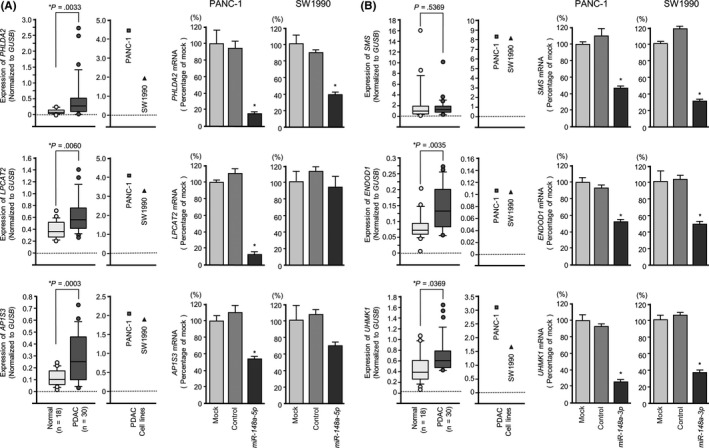
Messenger RNA expression of target genes of miR‐148a‐5p and miR‐148a‐3p on clinical sample and directly regulation of mRNA expression by miR‐148a‐5p and miR‐148a‐3p transfectants in pancreatic ductal adenocarcinoma (PDAC) cell lines. A, Expression levels of miR‐148a‐5p target genes (PHLDA2, LPCAT2, AP1S3) in PDAC clinical specimens and cell lines were determined by qRT‐PCR. GUSB was used as an internal control, data were normalized to GUSB expression (left), *P < .05. Gene expression was directly downregulated by transfection of miR‐148a‐5p mimic (right), *P < .0001. B, Expression levels of miR‐148a‐3p target genes (SMS,ENDOD1,UHMK1) in PDAC clinical specimens and cell lines were determined by qRT‐PCR. GUSB was used as an internal control, data were normalized to GUSB expression (left), *P < .05. Gene expression was directly downregulated by transfection of miR‐148a‐3p mimic (right), *P < .0001
In the present study, we focused on the Pleckstrin Homology Like Domain Family A Member 2 (PHLDA2) because miR‐148a‐5p (passenger strand) achieved the greatest degree of downregulation (Figure 4A, upper, right).
3.6. Direct regulation of PHLDA2 by miR‐148a‐5p in PDAC cells
Negative correlations were detected between miR‐148a‐5p and PHLDA2 expression (R = −.495, P = .0007, Figure 5A). Both PHLDA2 mRNA and PHLDA2 protein levels were markedly reduced in miR‐148a‐5p transfectant cells (Figure 4A, upper, right, Figure 5B).
Figure 5.
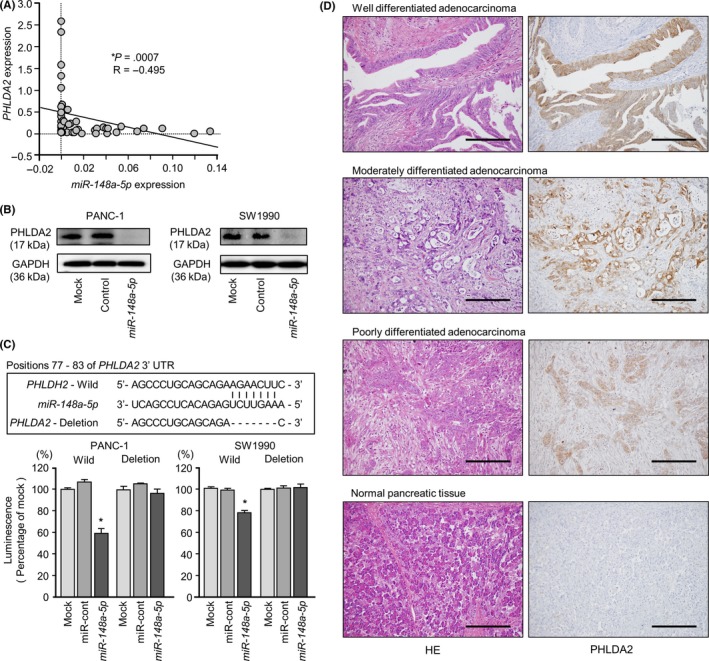
Direct regulation of PHLDA2 by miR‐148a‐5p in pancreatic ductal adenocarcinoma (PDAC) cell lines and immunohistochemical staining of PHLDA2 protein in PDAC clinical specimens. A, Expression levels of PHLDA2 and miR‐148a‐5p were negatively correlated. B, PHLDA2 protein expression in PDAC cell lines was evaluated by western blot analyses 96 h after transfection with miR‐148a‐5p. GAPDH was used as a loading control. C, miR‐148a‐5p binding sites in the 3′‐UTR of PHLDA2 mRNA. Dual luciferase reporter assays using vectors encoding the putative miR‐148a‐5p (positions 77‐83) target site of the PHLDA2 3′‐UTR for both wild‐type and deleted regions. Normalized data were calculated as ratios of Renilla/firefly luciferase activities, *P < .05. D, Immunohistochemical staining of PHLDA2 in PDAC specimens. All differentiated types of PDAC (well, moderate and poor) showed strong intracellular immunoreactivity (left panel, H&S staining; right panel, PHLDA2 staining; original magnification, ×200; scale bars, 200 μm)
The putative target site in the 3′‐UTR of PHLDA2 is shown in Figure S1. Luminescence intensity was significantly reduced by cotransfection with miR‐148a‐5p and the vector carrying the wild‐type 3′‐UTR (position 77‐83), whereas transfection with the deletion vector (deletion of binding site) blocked the decrease in luminescence (P < .0001, Figure 5C).
A total of 30 specimens was evaluated by immunohistochemical staining. All tumors were of differentiated adenocarcinoma type (well, moderate and poor) and showed strong intracellular immunoreactivity. However, normal pancreatic tissue was not stained (Figure 5D).
3.7. Effects of silencing PHLDA2 on PDAC cell lines
To investigate the oncogenic functions of PHLDA2 in PDAC cells by using si‐PHLDA2, we evaluated the knockdown efficiency of si‐PHLDA2 transfection in PDAC cell lines. In this assay, we used 2 types of si‐PHLDA2 (si‐PHLDA2‐1 and si‐PHLDA2‐2). Both siRNAs effectively downregulated PHLDA2 mRNA/PHLDA2 protein expression in both cell lines (P < .0001, Figure 6A,B).
Figure 6.
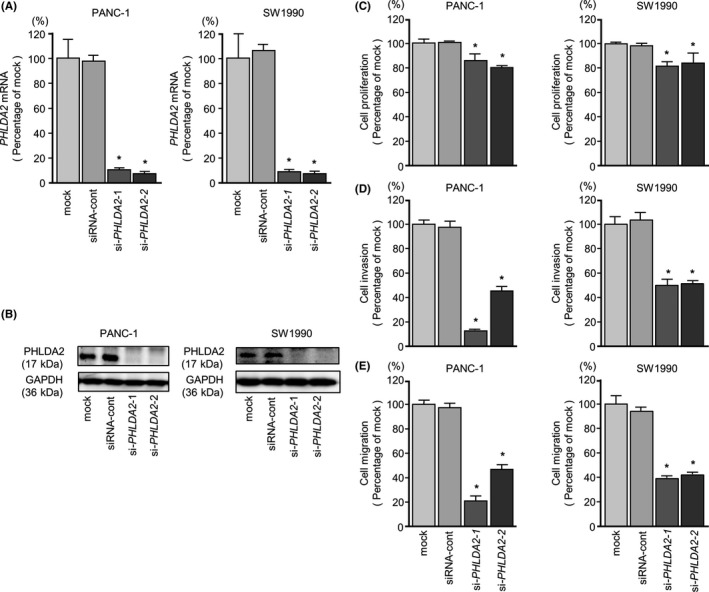
PHLDA2 mRNA and PHLDA2 protein expression after si‐PHLDA2 transfection and the effects of PHLDA2 knockdown in pancreatic ductal adenocarcinoma (PDAC) cell lines. A, PHLDA2 mRNA expression in PDAC cell lines was evaluated by qRT‐PCR 72 h after transfection with si‐PHLDA2‐1 or si‐PHLDA2‐2. GUSB was used as an internal control, data were normalized to GUSB expression. B, PHLDA2 protein expression in PDAC cell lines was evaluated by western blot analysis 96 h after transfection with si‐PHLDA2‐1 and si‐PHLDA2‐2. GAPDH was used as a loading control. C, Cell proliferation was determined with XTT assays 72 h after transfection with 10 nmol/L si‐PHLDA2‐1 or si‐PHLDA2‐2, *P < .0001. D, Cell invasion activity was determined using Matrigel invasion assays, *P < .0001. E, Cell migration activity was determined by migration assays, *P < .0001
Cancer cell proliferation, migration and invasion abilities were inhibited in si‐PHLDA2 transfectants compared with mock‐ or siRNA‐control‐transfected cells (Figure 6C‐E). In the apoptosis assays, si‐PHLDA2‐1 and si‐PHLDA2‐2 transfection significantly increased apoptotic cells in PANC‐1 cells (Figure S4A‐C).
3.8. Effects of cotransfection of PHLDA2 and miR‐148a‐5p in PDAC cell lines
To confirm the antitumor effect of miR‐148a‐5p, we carried out rescue experiments using PHLDA2 overexpression in PDAC cells with miR‐148a‐5p restoration. Rescue studies indicated that cancer cell migration and invasion properties were rescued by PHLDA2 transfectants compared with cells with restored miR‐148a‐5p only (Figure 7). These data indicated that PHLDA2 expression was regulated by miR‐148a‐5p and expression of miR‐148a‐5p induced antitumor effects on migration and invasion in PDAC cells.
Figure 7.
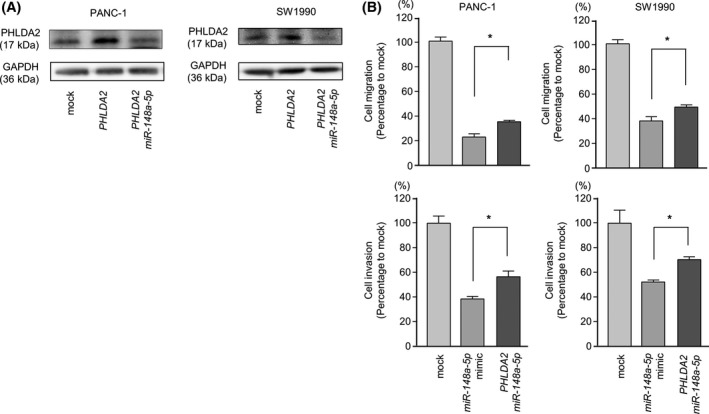
Rescue experiments: induction of PHLDA2 overexpression in pancreatic ductal adenocarcinoma (PDAC) cell lines with miR‐148a‐5p restoration. A, PHLDA2 protein overexpression in PANC‐1 and SW1990 was evaluated by western blot analyses 72 h after 0.5 μg/well transfection with PHLDA2 cDNA plasmid (middle bands). PHLDA2 protein overexpression was attenuated 72 h after cotransfection with 0.5 μg/well PHLDA2 cDNA plasmid and 10 nmol/L miR‐148a‐5p mimic (right bands). GAPDH was used as a loading control. B, Cell migration activity was assessed 72 h after cotransfection with 0.5 μg/well PHLDA2 cDNA plasmid and 10 nmol/L miR‐148a‐5p mimic, *P < .0001. Cell invasion activity was determined using Matrigel invasion assays 72 h after cotransfection with 0.5 μg/well PHLDA2 cDNA plasmid and 10 nmol/L miR‐148a‐5p mimic, *P < .0001
3.9. Investigation of downstream genes regulated by PHLDA2 in PDAC cells
Our selection strategy of downstream genes regulated by PHLDA2 is shown in Figure 8A. A total of 530 genes was commonly downregulated (log2 ratio < −1.0) in si‐PHLDA2‐transfected PANC‐1 cells. We also assessed the upregulated genes in PDAC tissues by GEO database analyses (GEO accession number GSE15471). With that approach, we identified 37 genes (Table 5). Our microarray expression data were deposited in the GEO database (accession number GSE106791).
Figure 8.
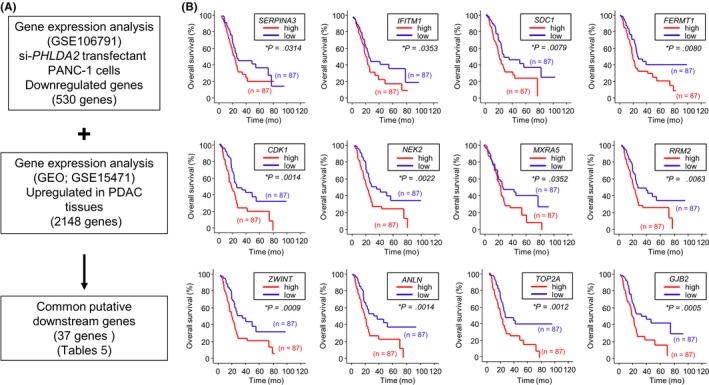
Strategy for analysis of PHLDA2 downstream genes. A, Flow chart illustrates the strategy for analysis of PHLDA2‐mediated downstream genes in pancreatic ductal adenocarcinoma (PDAC) cells. B, Kaplan–Meier plots of overall survival with log‐rank tests between those with high and low expression of 12 genes downstream from PHLDA2 in the PDAC Cancer Genome Atlas (TCGA) database. GEO, Gene Expression Omnibus
Table 5.
Downregulated genes by si‐PHLDA2 transfectants
| Entrez gene ID | Gene symbol | Gene name | Mock vs si‐PHLDA2_2 | GEO | OncoLnc |
|---|---|---|---|---|---|
| logFC | logFC | P‐value | |||
| 12 | SERPINA3 | Serpin peptidase inhibitor, clade A (alpha‐1 antiproteinase, antitrypsin), member 3 | −2.4052 | 1.1210 | .0314 |
| 115207 | KCTD12 | Potassium channel tetramerization domain containing 12 | −1.7676 | 1.2730 | .0245 |
| 25924 | MYRIP | Myosin VIIA and Rab interacting protein | −1.7485 | 1.4215 | .099 |
| 8519 | IFITM1 | Interferon induced transmembrane protein 1 | −1.5832 | 1.4437 | .0353 |
| 23621 | BACE1 | Beta‐site APP‐cleaving enzyme 1 | −1.5579 | 1.6490 | .31 |
| 6382 | SDC1 | Syndecan 1 | −1.5511 | 1.3845 | .00787 |
| 5738 | PTGFRN | Prostaglandin F2 receptor inhibitor | −1.4976 | 1.4021 | .35 |
| 56605 | ERO1LB | ERO1‐like beta (S. cerevisiae) | −1.4052 | 1.6621 | No data |
| 92241 | RCSD1 | RCSD domain containing 1 | −1.3758 | 1.1930 | .569 |
| 23075 | SWAP70 | SWAP switching B‐cell complex 70 kDa subunit | −1.3742 | 1.0542 | .51 |
| 55612 | FERMT1 | Fermitin family member 1 | −1.3590 | 1.6579 | .00799 |
| 3613 | IMPA2 | Inositol(myo)‐1(or 4)‐monophosphatase 2 | −1.3188 | 1.5101 | .615 |
| 57619 | SHROOM3 | Shroom family member 3 | −1.3051 | 1.1286 | .132 |
| 2494 | NR5A2 | Nuclear receptor subfamily 5, group A, member 2 | −1.2469 | 1.5494 | .209 |
| 983 | CDK1 | Cyclin‐dependent kinase 1 | −1.2366 | 1.4143 | .00137 |
| 54492 | NEURL1B | Neuralized E3 ubiquitin protein ligase 1B | −1.2230 | 1.2359 | .154 |
| 11037 | STON1 | Stonin 1 | −1.2048 | 1.5983 | .654 |
| 10403 | NDC80 | NDC80 kinetochore complex component | −1.1913 | 1.5473 | .126 |
| 253827 | MSRB3 | Methionine sulfoxide reductase B3 | −1.1684 | 1.8859 | .902 |
| 4751 | NEK2 | NIMA‐related kinase 2 | −1.1547 | 1.0279 | .0022 |
| 25878 | MXRA5 | Matrix‐remodeling associated 5 | −1.1433 | 2.3870 | .0352 |
| 285590 | SH3PXD2B | SH3 and PX domains 2B | −1.1361 | 1.3111 | .848 |
| 84168 | ANTXR1 | Anthrax toxin receptor 1 | −1.1311 | 2.9025 | .28 |
| 51316 | PLAC8 | Placenta‐specific 8 | −1.1274 | 1.6964 | .0588 |
| 6241 | RRM2 | Ribonucleotide reductase M2 | −1.1057 | 1.1664 | .00627 |
| 11130 | ZWINT | ZW10 interacting kinetochore protein | −1.1000 | 1.1604 | .000948 |
| 1728 | NQO1 | NAD(P)H dehydrogenase, quinone 1 | −1.0986 | 2.1867 | .61 |
| 54443 | ANLN | Anillin, actin binding protein | −1.0854 | 1.7292 | .00142 |
| 56925 | LXN | Latexin | −1.0769 | 2.0471 | .964 |
| 7153 | TOP2A | Topoisomerase (DNA) II alpha 170 kDa | −1.0455 | 1.5302 | .0012 |
| 4085 | MAD2L1 | MAD2 mitotic arrest deficient‐like 1 (yeast) | −1.0324 | 1.1864 | .108 |
| 2706 | GJB2 | Gap junction protein, beta 2, 26 kDa | −1.0296 | 3.6935 | .000459 |
| 1999 | ELF3 | E74‐like factor 3 (ets domain transcription factor, epithelial‐specific) | −1.0295 | 1.1854 | .174 |
| 9891 | NUAK1 | NUAK family, SNF1‐like kinase, 1 | −1.0212 | 1.6399 | .827 |
| 4016 | LOXL1 | Lysyl oxidase‐like 1 | −1.0207 | 2.3387 | .778 |
| 1786 | DNMT1 | DNA (cytosine‐5)‐methyltransferase 1 | −1.0184 | 1.2180 | .117 |
| 3223 | HOXC6 | Homeobox C6 | −1.0145 | 1.9164 | .391 |
Bold values, Kaplan‐Meier analysis log‐rank P‐value <.05, poor prognosis with a high expression.
Italic value, Kaplan‐Meier analysis log‐rank P‐value <.05, poor prognosis with a low expression.
GEO, Gene Expression Omnibus; PDAC, pancreatic ductal adenocarcinoma.
Furthermore, we checked the expression status of those genes and their pathological relations to PDAC by using TCGA‐based large cohort study data. Kaplan‐Meier analysis showed that PDAC patients with high expression of 12 genes (SERPINA3, IFTM1, SDC1, FERMT1, CDK1, NEK2, MIXRA5, RRM2, ZWINT, ANLN, TOP2A and GJB2) had significantly poorer overall survival (Figure 8B).
4. DISCUSSION
Despite recent developments in treatment, advanced PDAC cannot be cured. Novel approaches for identification of therapeutic targets of PDAC are needed. Based on this, we have identified antitumor miRNAs that regulate cancer pathways in PDAC cells.26 Our miRNA expression signature of PDAC showed that some passenger strands of miRNAs were significantly downregulated in PDAC.8 We hypothesize that the data could help to identify miRNAs important for the development and progression of PDAC. In the present study, we focused on pre‐miR‐148a strands: miR‐148a‐5p (the passenger strand) and miR‐148a‐3p (the guide strand). With this focus, we investigated the functional significance of these specific miRNAs and regulatory RNA networks in PDAC cells.
In the human genome, the miR‐148‐family consists of 3 members that are located in different chromosomal regions: miR‐148a is at 7p15.2, miR‐148b is at 12q13.13 and miR‐152 is at 17q21.32.27, 28 The mature sequences of the guide strands of these miRNAs are similar and the seed sequences (UCAGUGCA) are identical.29 Most analyses have focused on guide strands of the miR‐148‐family in normal physiological conditions or in cancer cells.30, 31 A large number of previous studies showed that miR‐148a‐3p (the guide strand) was downregulated in several types of cancer (eg, gastric cancer, colon cancer, hepatocellular carcinoma, breast cancer and PDAC).32, 33, 34, 35, 36 The miR‐148a gene contains a large number of CpG islands in the promoter (Figure S3A). In hepatocellular cancer, miR‐148a is silenced by DNA hypermethylation.37 In pancreatic cancer, a past study reported that aberrant hypermethylation of the miR‐148a coding region progresses as pancreatic cancer malignancy increases.38 We showed that hypermethylation suppresses miR‐148a‐5p and miR‐148a‐3p even in PDAC (Figure S3B). Our present study of miR‐148a‐3p is consistent with previous reports. A new finding of the present analysis was that miR‐148a‐5p (the passenger strand) acted as an antitumor miRNA as did miR‐148‐3p (the guide strand) in PDAC cells. Involvement of the passenger strand of miRNA in cancer pathogenesis is a new concept in the field of miRNA research.
In the present study, we identified oncogenic genes regulated by miR‐148a‐5p and miR‐148a‐3p in PDAC cells by using genome‐wide gene expression and miRNA database analyses. Three genes (PHLDA2, LPCAT2 and AP1S3) were regulated by miR‐148a‐5p (passenger strand) and were identified as putative oncogenic genes in PDAC pathogenesis. Similarly, 3 genes (SAS, ENDOD1 and UHMK1) were found to be regulated by miR‐148‐3p (the guide strand). Analysis of these genes will contribute to the elucidation of the molecular mechanism of PDAC pathogenesis.
We focused on PHLDA2 and investigated its oncogenic functions because its expression in 2 pancreatic cancer cell lines showed the greatest suppression by miR‐148a‐5p (passenger strand). Moreover, the role of PHLDA2 has been controversial in other carcinomas (ie, its roles as an “oncogene” or “tumor suppressor” are unclear).39, 40 Clinical features in TCGA database of PDAC patients showed there were no significant relationships in T, N, and M of TMN stage (data not shown). However, high expression of PHLDA2 related to poor OS and DFS. Past studies showed that PHLDA2 acted as a growth‐suppressive gene.41 PHLDA2 is located on human chromosome 11p15.5, a location known for imprinting gene clusters.42 It is well known that dysregulation of this gene cluster is associated with Beckwith‐Wiedemann syndrome.43 To investigate the functional significance of PHLDA2, knockout mice or transgenic mouse studies have been carried out.44 In PHLDA2 null mice, placenta overgrowth was observed and overexpression of PHLDA2 resulted in placental stunting.45 In humans, upregulation of PHLDA2 was observed in intrauterine growth restriction placentas.46 However, the relationship between PHLDA2 expression and human cancers is not clear.
Our present study showed that PHLDA2 was overexpressed in PDAC clinical specimens and that its expression enhanced cancer cell migration and invasion in PDAC cells. Moreover, high expression of PHLDA2 was significantly associated with poor prognosis of PDAC patients based upon a large cohort study. These findings indicate that aberrantly expressed PHLDA2 acts like a cancer‐promoting gene in PDAC cells. TCGA database analyses indicate that high expression of PHLDA2 is significantly associated with poor prognoses in several types of cancer (eg, renal cell carcinoma, hepatocellular carcinoma and glioma). Functional analysis will be necessary to verify the cancer‐promoting effects of PHLDA2.
Finally, we investigated genes mediated by PHLDA2 in PDAC cells. Interestingly, past studies showed that aberrant expression of several of the genes (SDC1, CDK1, ANLN and TOP2A) contributes to cancer cell aggressiveness.18, 47, 48, 49 Among these genes, a total of 12 were deeply involved in PDAC pathogenesis by TCGA analyses. Our data suggest that overexpression of PHLDA2 might induce the expression of downstream cancer‐promoting genes in PDAC cells. These results suggest that PHLDA2 might be a possible therapeutic target for PDAC patients.
In conclusion, both strands of pre‐miR‐148a (miR‐148a‐5p and miR‐148a‐3p) were significantly reduced in PDAC clinical specimens. The passenger strand, miR‐148a‐5p, had a potent antitumor function through targeting of cancer‐promoting genes in PDAC cells. PHLDA2 was markedly elevated in PDAC, and it was involved in PDAC pathogenesis, suggesting PHLDA2 could be used as a therapeutic target in PDAC. The involvement of passenger strand miRNAs in the regulation of cellular processes is a novel concept in RNA research.
CONFLICT OF INTEREST
Authors declare no conflicts of interest for this article.
Supporting information
ACKNOWLEDGMENT
This study was supported by Japan Society for the Promotion of Science 15K15501, 26293306, 26462067, 17K16778 and 15K10801.
Idichi T, Seki N, Kurahara H, et al. Molecular pathogenesis of pancreatic ductal adenocarcinoma: Impact of passenger strand of pre‐miR‐148a on gene regulation. Cancer Sci. 2018;109:2013–2026. https://doi.org/10.1111/cas.13610
REFERENCES
- 1. Kamisawa T, Wood LD, Itoi T, Takaori K. Pancreatic cancer. Lancet. 2016;388:73‐85. [DOI] [PubMed] [Google Scholar]
- 2. Gillen S, Schuster T, Meyer Zum Buschenfelde C, Friess H, Kleeff J. Preoperative/neoadjuvant therapy in pancreatic cancer: a systematic review and meta‐analysis of response and resection percentages. PLoS Med. 2010;7:e1000267. [DOI] [PMC free article] [PubMed] [Google Scholar]
- 3. Chrystoja CC, Diamandis EP, Brand R, Ruckert F, Haun R, Molina R. Pancreatic cancer. Clin Chem. 2013;59:41‐46. [DOI] [PubMed] [Google Scholar]
- 4. Bartel DP. MicroRNAs: target recognition and regulatory functions. Cell. 2009;136:215‐233. [DOI] [PMC free article] [PubMed] [Google Scholar]
- 5. Zhang Y, Wang Z, Gemeinhart RA. Progress in microRNA delivery. J Control Release. 2013;172:962‐974. [DOI] [PMC free article] [PubMed] [Google Scholar]
- 6. Fukumoto I, Hanazawa T, Kinoshita T, et al. MicroRNA expression signature of oral squamous cell carcinoma: functional role of microRNA‐26a/b in the modulation of novel cancer pathways. Br J Cancer. 2015;112:891‐900. [DOI] [PMC free article] [PubMed] [Google Scholar]
- 7. Fuse M, Kojima S, Enokida H, et al. Tumor suppressive microRNAs (miR‐222 and miR‐31) regulate molecular pathways based on microRNA expression signature in prostate cancer. J Hum Genet. 2012;57:691‐699. [DOI] [PubMed] [Google Scholar]
- 8. Yonemori K, Seki N, Idichi T, et al. The microRNA expression signature of pancreatic ductal adenocarcinoma by RNA sequencing: anti‐tumour functions of the microRNA‐216 cluster. Oncotarget. 2017;8:70097‐70115. [DOI] [PMC free article] [PubMed] [Google Scholar]
- 9. Gregory RI, Chendrimada TP, Cooch N, Shiekhattar R. Human RISC couples microRNA biogenesis and posttranscriptional gene silencing. Cell. 2005;123:631‐640. [DOI] [PubMed] [Google Scholar]
- 10. Hutvagner G, Zamore PD. A microRNA in a multiple‐turnover RNAi enzyme complex. Science. 2002;297:2056‐2060. [DOI] [PubMed] [Google Scholar]
- 11. Matranga C, Tomari Y, Shin C, Bartel DP, Zamore PD. Passenger‐strand cleavage facilitates assembly of siRNA into Ago2‐containing RNAi enzyme complexes. Cell. 2005;123:607‐620. [DOI] [PubMed] [Google Scholar]
- 12. Koshizuka K, Hanazawa T, Kikkawa N, et al. Regulation of ITGA3 by the anti‐tumor miR‐199 family inhibits cancer cell migration and invasion in head and neck cancer. Cancer Sci. 2017;108:1681‐1692. [DOI] [PMC free article] [PubMed] [Google Scholar]
- 13. Osako Y, Seki N, Koshizuka K, et al. Regulation of SPOCK1 by dual strands of pre‐miR‐150 inhibit cancer cell migration and invasion in esophageal squamous cell carcinoma. J Hum Genet. 2017;62:935‐944. [DOI] [PubMed] [Google Scholar]
- 14. Goto Y, Kurozumi A, Arai T, et al. Impact of novel miR‐145‐3p regulatory networks on survival in patients with castration‐resistant prostate cancer. Br J Cancer. 2017;117:409‐420. [DOI] [PMC free article] [PubMed] [Google Scholar]
- 15. Mataki H, Seki N, Mizuno K, et al. Dual‐strand tumor‐suppressor microRNA‐145 (miR‐145‐5p and miR‐145‐3p) coordinately targeted MTDH in lung squamous cell carcinoma. Oncotarget. 2016;7:72084‐72098. [DOI] [PMC free article] [PubMed] [Google Scholar]
- 16. Matsushita R, Yoshino H, Enokida H, et al. Regulation of UHRF1 by dual‐strand tumor‐suppressor microRNA‐145 (miR‐145‐5p and miR‐145‐3p): inhibition of bladder cancer cell aggressiveness. Oncotarget. 2016;7:28460‐28487. [DOI] [PMC free article] [PubMed] [Google Scholar]
- 17. Sobin LH, Gospodarowicz MK, Wittekind C, eds. TNM Classification of Malignant Tumours, 7th edn Chichester, UK: Wiley‐Blackwell; 2010. [Google Scholar]
- 18. Idichi T, Seki N, Kurahara H, et al. Regulation of actin‐binding protein ANLN by antitumor miR‐217 inhibits cancer cell aggressiveness in pancreatic ductal adenocarcinoma. Oncotarget. 2017;8:53180‐53193. [DOI] [PMC free article] [PubMed] [Google Scholar]
- 19. Yonemori K, Seki N, Kurahara H, et al. ZFP36L2 promotes cancer cell aggressiveness and is regulated by antitumor microRNA‐375 in pancreatic ductal adenocarcinoma. Cancer Sci. 2017;108:124‐135. [DOI] [PMC free article] [PubMed] [Google Scholar]
- 20. Kinoshita T, Nohata N, Hanazawa T, et al. Tumour‐suppressive microRNA‐29s inhibit cancer cell migration and invasion by targeting laminin‐integrin signalling in head and neck squamous cell carcinoma. Br J Cancer. 2013;109:2636‐2645. [DOI] [PMC free article] [PubMed] [Google Scholar]
- 21. Miyamoto K, Seki N, Matsushita R, et al. Tumour‐suppressive miRNA‐26a‐5p and miR‐26b‐5p inhibit cell aggressiveness by regulating PLOD2 in bladder cancer. Br J Cancer. 2016;115:354‐363. [DOI] [PMC free article] [PubMed] [Google Scholar]
- 22. Ichimi T, Enokida H, Okuno Y, et al. Identification of novel microRNA targets based on microRNA signatures in bladder cancer. Int J Cancer. 2009;125:345‐352. [DOI] [PubMed] [Google Scholar]
- 23. Osako Y, Seki N, Kita Y, et al. Regulation of MMP13 by antitumor microRNA‐375 markedly inhibits cancer cell migration and invasion in esophageal squamous cell carcinoma. Int J Oncol. 2016;49:2255‐2264. [DOI] [PMC free article] [PubMed] [Google Scholar]
- 24. Anaya J. OncoLnc: linking TCGA survival data to mRNAs, miRNAs, and lncRNAs. PeerJ Comput Sci. 2016;2:e67. [Google Scholar]
- 25. Anaya J. OncoRank: a pan‐cancer method of combining survival correlations and its application to mRNAs, miRNAs, and lncRNAs. PeerJ Prepr. 2016;1:e2574. [Google Scholar]
- 26. Yonemori K, Kurahara H, Maemura K, Natsugoe S. MicroRNA in pancreatic cancer. J Hum Genet. 2017;62:33‐40. [DOI] [PubMed] [Google Scholar]
- 27. Chen X, Wang G, Lu X, et al. Polymorphisms and haplotypes of the miR‐148/152 family are associated with the risk and clinicopathological features of gastric cancer in a Northern Chinese population. Mutagenesis. 2014;29:401‐407. [DOI] [PubMed] [Google Scholar]
- 28. Friedrich M, Pracht K, Mashreghi MF, Jack HM, Radbruch A, Seliger B. The role of the miR‐148/‐152 family in physiology and disease. Eur J Immunol. 2017;47:2026‐2038. [DOI] [PubMed] [Google Scholar]
- 29. Chen Y, Song YX, Wang ZN. The microRNA‐148/152 family: multi‐faceted players. Mol Cancer. 2013;12:43. [DOI] [PMC free article] [PubMed] [Google Scholar]
- 30. Li Y, Deng X, Zeng X, Peng X. The role of Mir‐148a in cancer. J Cancer. 2016;7:1233‐1241. [DOI] [PMC free article] [PubMed] [Google Scholar]
- 31. Miao C, Zhang J, Zhao K, et al. The significance of microRNA‐148/152 family as a prognostic factor in multiple human malignancies: a meta‐analysis. Oncotarget. 2017;8:43344‐43355. [DOI] [PMC free article] [PubMed] [Google Scholar]
- 32. Xia J, Guo X, Yan J, Deng K. The role of miR‐148a in gastric cancer. J Cancer Res Clin Oncol. 2014;140:1451‐1456. [DOI] [PubMed] [Google Scholar]
- 33. Takahashi M, Cuatrecasas M, Balaguer F, et al. The clinical significance of MiR‐148a as a predictive biomarker in patients with advanced colorectal cancer. PLoS ONE. 2012;7:e46684. [DOI] [PMC free article] [PubMed] [Google Scholar]
- 34. Pan L, Huang S, He R, Rong M, Dang Y, Chen G. Decreased expression and clinical significance of miR‐148a in hepatocellular carcinoma tissues. Eur J Med Res. 2014;19:68. [DOI] [PMC free article] [PubMed] [Google Scholar]
- 35. Xu X, Zhang Y, Jasper J, et al. MiR‐148a functions to suppress metastasis and serves as a prognostic indicator in triple‐negative breast cancer. Oncotarget. 2016;7:20381‐20394. [DOI] [PMC free article] [PubMed] [Google Scholar]
- 36. Feng H, Wang Y, Su J, et al. MicroRNA‐148a suppresses the proliferation and migration of pancreatic cancer cells by down‐regulating ErbB3. Pancreas. 2016;45:1263‐1271. [DOI] [PubMed] [Google Scholar]
- 37. Long XR, He Y, Huang C, Li J. MicroRNA‐148a is silenced by hypermethylation and interacts with DNA methyltransferase 1 in hepatocellular carcinogenesis. Int J Oncol. 2014;44:1915‐1922. [DOI] [PubMed] [Google Scholar]
- 38. Hanoun N, Delpu Y, Suriawinata AA, et al. The silencing of microRNA 148a production by DNA hypermethylation is an early event in pancreatic carcinogenesis. Clin Chem. 2010;56:1107‐1118. [DOI] [PubMed] [Google Scholar]
- 39. Moon HG, Oh K, Lee J, et al. Prognostic and functional importance of the engraftment‐associated genes in the patient‐derived xenograft models of triple‐negative breast cancers. Breast Cancer Res Treat. 2015;154:13‐22. [DOI] [PubMed] [Google Scholar]
- 40. Wang X, Li G, Koul S, et al. PHLDA2 is a key oncogene‐induced negative feedback inhibitor of EGFR/ErbB2 signaling via interference with AKT signaling. Oncotarget. 2018;9:24914‐24926. [DOI] [PMC free article] [PubMed] [Google Scholar]
- 41. Jensen AB, Tunster SJ, John RM. The significance of elevated placental PHLDA2 in human growth restricted pregnancies. Placenta. 2014;35:528‐532. [DOI] [PubMed] [Google Scholar]
- 42. Smith AC, Choufani S, Ferreira JC, Weksberg R. Growth regulation, imprinted genes, and chromosome 11p15.5. Pediatr Res. 2007;61:43R‐47R. [DOI] [PubMed] [Google Scholar]
- 43. Choufani S, Shuman C, Weksberg R. Molecular findings in Beckwith‐Wiedemann syndrome. Am J Med Genet 2013;163c:131‐140. [DOI] [PubMed] [Google Scholar]
- 44. Frank D, Fortino W, Clark L, et al. Placental overgrowth in mice lacking the imprinted gene Ipl. Proc Natl Acad Sci USA. 2002;99:7490‐7495. [DOI] [PMC free article] [PubMed] [Google Scholar]
- 45. Salas M, John R, Saxena A, et al. Placental growth retardation due to loss of imprinting of Phlda2. Mech Dev. 2004;121:1199‐1210. [DOI] [PubMed] [Google Scholar]
- 46. Cordeiro A, Neto AP, Carvalho F, Ramalho C, Doria S. Relevance of genomic imprinting in intrauterine human growth expression of CDKN1C, H19, IGF2, KCNQ1 and PHLDA2 imprinted genes. J Assist Reprod Genet. 2014;31:1361‐1368. [DOI] [PMC free article] [PubMed] [Google Scholar]
- 47. Inki P, Jalkanen M. The role of syndecan‐1 in malignancies. Ann Med. 1996;28:63‐67. [DOI] [PubMed] [Google Scholar]
- 48. Gan W, Zhao H, Li T, Liu K, Huang J. CDK1 interacts with iASPP to regulate colorectal cancer cell proliferation through p53 pathway. Oncotarget. 2017;8:71618‐71629. [DOI] [PMC free article] [PubMed] [Google Scholar]
- 49. Pei YF, Yin XM, Liu XQ. TOP2A induces malignant character of pancreatic cancer through activating beta‐catenin signaling pathway. Biochim Biophys Acta. 2017;1864:197‐207. [DOI] [PubMed] [Google Scholar]
Associated Data
This section collects any data citations, data availability statements, or supplementary materials included in this article.
Supplementary Materials


