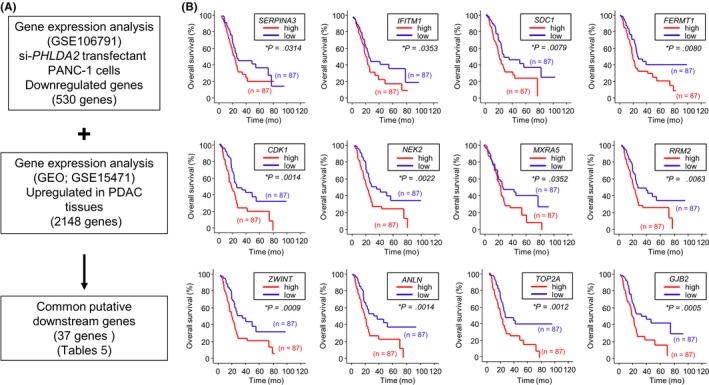
Figure 8.

Strategy for analysis of PHLDA2 downstream genes. A, Flow chart illustrates the strategy for analysis of PHLDA2‐mediated downstream genes in pancreatic ductal adenocarcinoma (PDAC) cells. B, Kaplan–Meier plots of overall survival with log‐rank tests between those with high and low expression of 12 genes downstream from PHLDA2 in the PDAC Cancer Genome Atlas (TCGA) database. GEO, Gene Expression Omnibus
