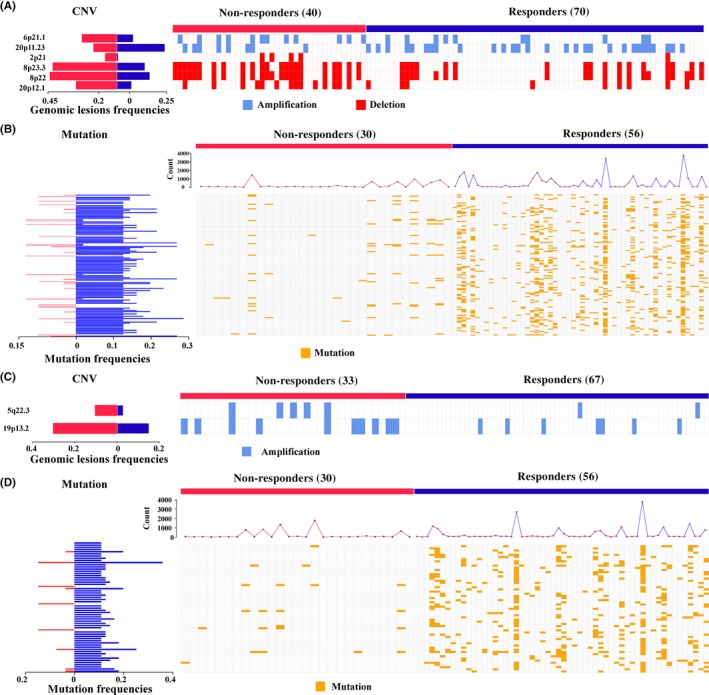
Figure 4.

Genomic characteristics between responders and non‐responders to adjuvant chemotherapy for colon cancer, predicted by gene pair signatures (3‐GPS). Genomic lesions between the two groups with the most significant difference for right‐sided colon cancer (RCC) (Fisher's exact test, P < .05) are displayed. (A,C) The difference in copy number variation (CNV) between the two groups for RCC (A) and left‐sided colon cancer (LCC) (C). (B,D) The difference in mutation frequency between two groups, RCC (B) and LCC (D). The frequencies of the two groups with lesions are shown at the left, and the detailed alternation of each lesion in each sample is shown at the right. The line chart represents the count of mutation genes in each sample
