Figure 6.

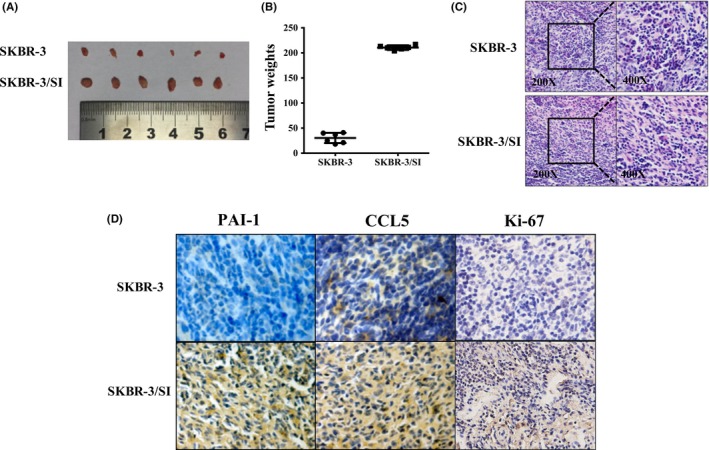
PAI‐1 and CCL5 expression was higher in SKBR‐3/SI tumors compared to SKBR‐3 tumors in vivo. A,B, The gross morphology of tumors and the final xenograft tumor weights measured on day 42 after injection of tumor cells (n = 6, **P < .01). C, The final xenograft tumor stained with routine H&E staining (200×, 400×). D, Representative images of expression of PAI‐1, CCL5 and Ki‐67 in 2 groups of tumor xenografts identified by immunohistochemistry. **P < .01
