
Figure 7.
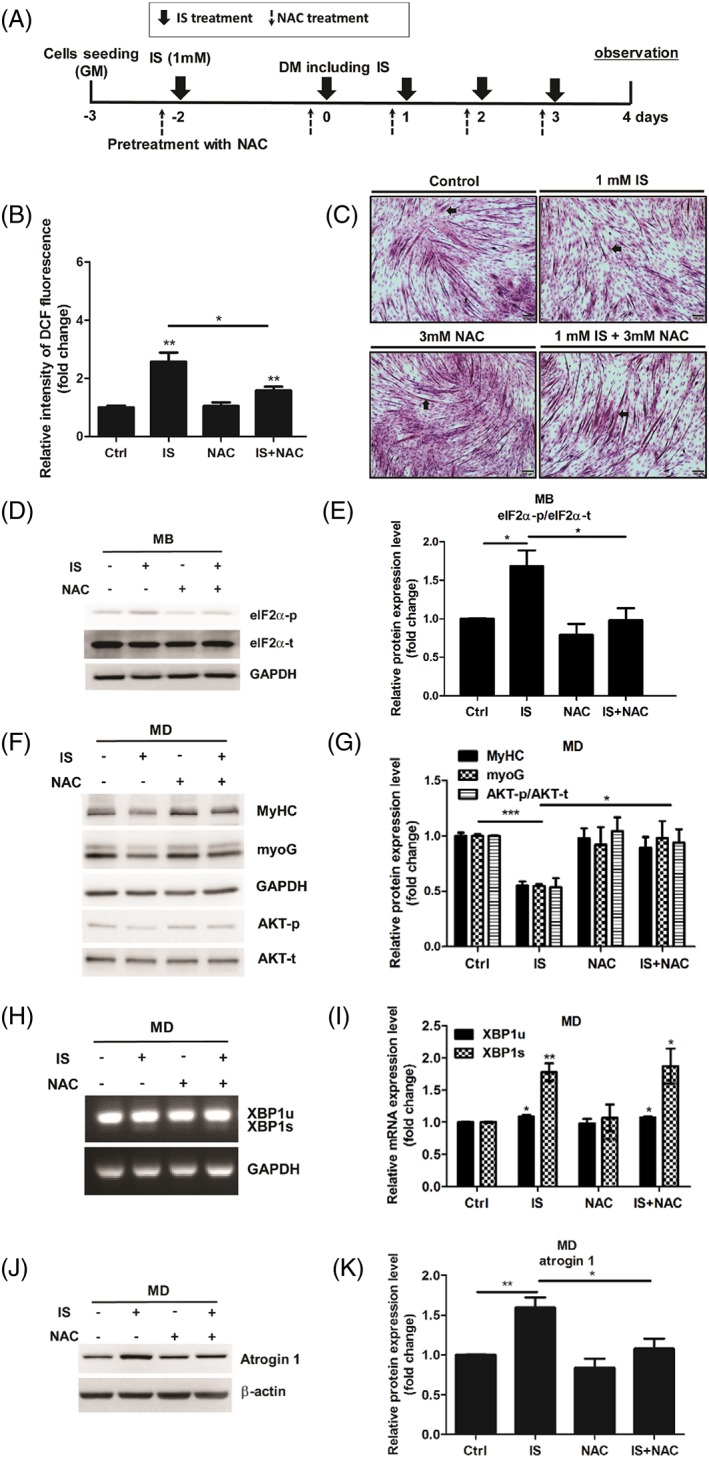
NAC treatment reverses IS‐induced defect in myogenic differentiation (MD). (A) Diagram illustrates timeline of experiment. (B) Flow cytometric quantitation of DCF fluorescence. (C) H&E staining of C2C12 myotubes under NAC (3 mM) or IS (1 mM) treatment, scale bars = 100 μm. The arrows indicate the fused myotubes. (D and E) myoblasts (MB) were treated with NAC (3 mM) or IS (1 mM) for 48 h. Phospho‐eIF2α expression was examined with western blot and quantified. (f‐k) Myoblasts under 48 h differentiation are simultaneously exposed with NAC (3 mM) or IS (1 mM). MyHC, myoG, and phospho‐AKT expression were determined with western blot and quantified (F and G). XBP1u and XBP1s mRNA expression are examined by agarose gel electrophoresis (H and I). Atrogin 1 expression are measured by western blot and quantified (J and K). The data were expressed as mean ± SED from three independent experiments. *P < 0.05, ** P < 0.01, and *** P < 0.001, as compared with untreated control.