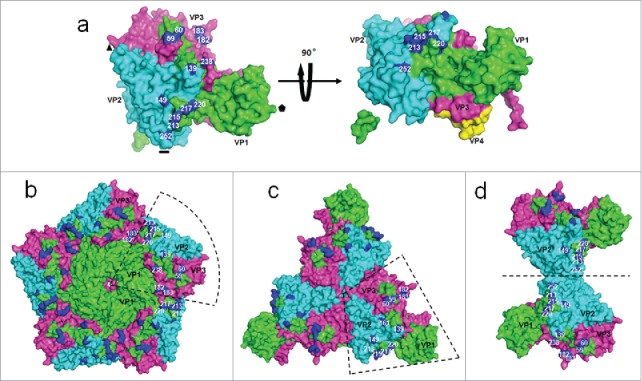
Figure 5.

The distribution of surface variant sites between G10 and circulating recombinant strains. (a) Asymmetric units of capsid are viewed from top and side. The indicates 5-fold axis; the ▴ indicates 3-fold axis, the indicates 2-fold axis. Capsid proteins are shown in green, cyan, and magenta for VP1, VP2 and VP3. The variant amino acids sites are shown in blue. These variant sites are mainly distributed in the interface of VP1, VP2 and VP3. (a) The view of distribution of variant sites in 5-fold axis. (c) The view of distribution of variant sites in 3-fold axis. (d) The view of distribution of variant sites in 2-fold axis. 182′ indicates the residue 182 of an adjacent protomer.
