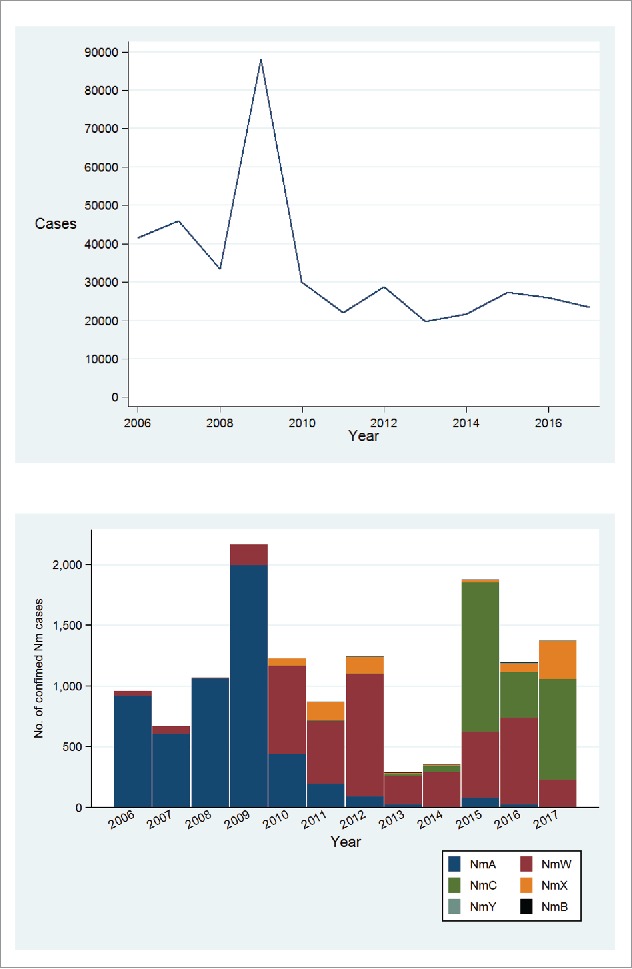
Figure 3.

Total number of suspected meningitis cases (panel A) and capsular group distribution of confimed IMD cases (panel B) in the meningitis belt, 2006 to June 2017. Based on publically available data from the World Health Organization (www.who.int/csr/disease/meningococcal/epidemiological/en/).35 Data for 2006–2016 represent totals for 52 weeks (January to December) while data for 2017 are totals for first 26 weeks of the year when a vast majority of cases occur.
