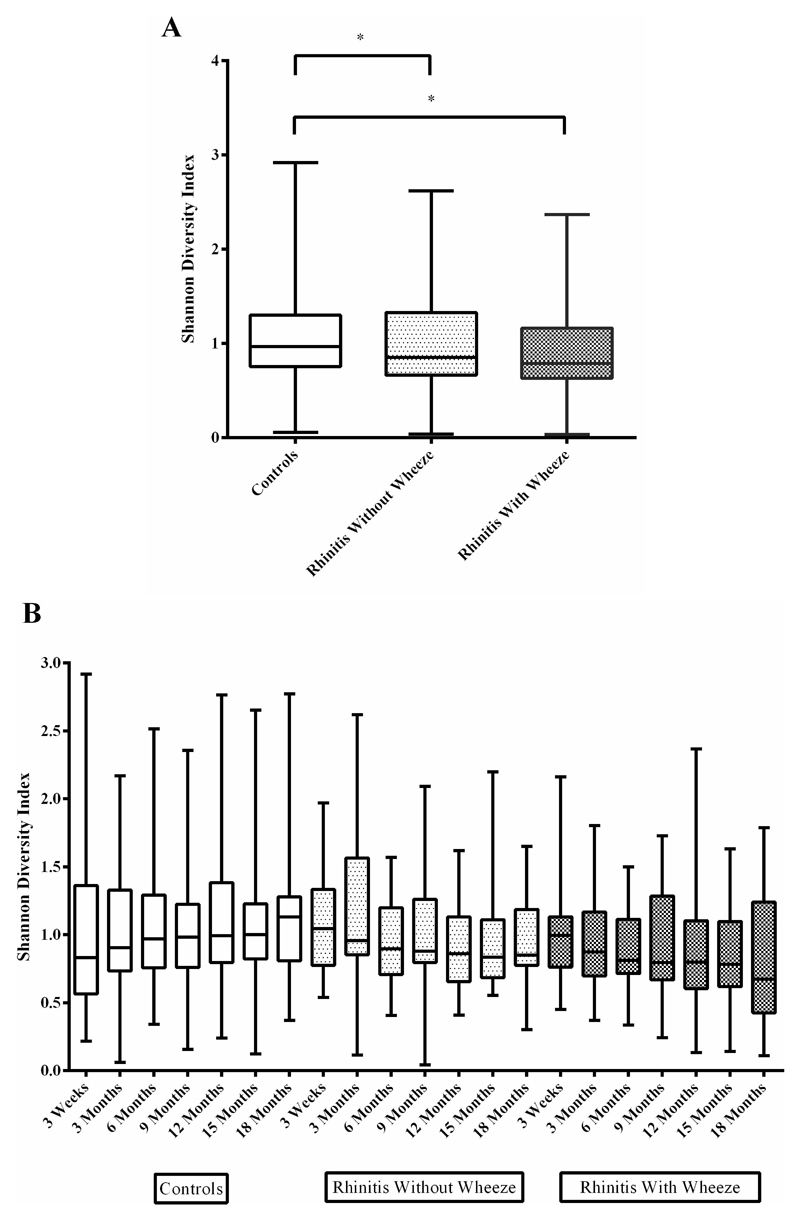
Figure 2.
Microbial diversity of the three clinical groups. (A) Overall Shannon Diversity combining all seven time-points from 3 weeks till 18 months; (B) Shannon diversity of the three clinical groups by time points. Max, min, 25th percentile, 75th percentile and geometric mean of relative abundance were used for box and whisker plot.
* denotes significance at p<0.05 between groups.

