Figure 3.

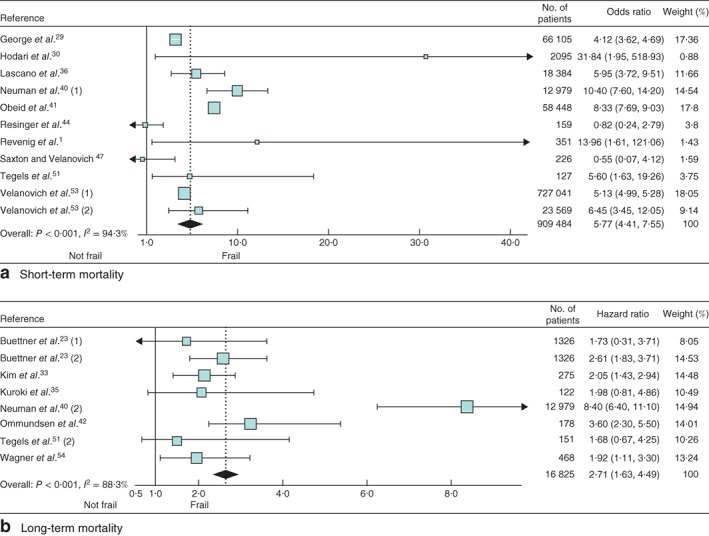
Forest plots of the effect of frailty on a short‐term and b long‐term mortality. Odds ratios and hazard ratios are shown with 95 per cent confidence intervals

Forest plots of the effect of frailty on a short‐term and b long‐term mortality. Odds ratios and hazard ratios are shown with 95 per cent confidence intervals