
Figure 3.
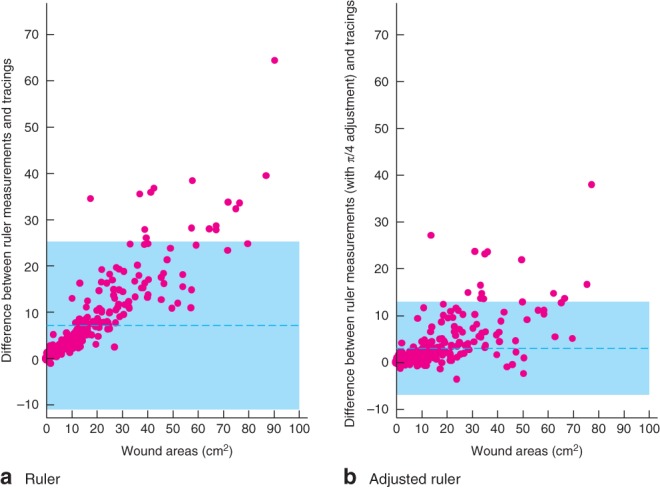
Bland–Altman plots demonstrating the agreement between measurements from wound tracings and measurements of wound area made using a a ruler and b an adjusted ruler. The difference between the two measurements made on the same observation (y‐axis) is plotted against the mean of the measurements (x‐axis), and each is represented with a dot. The shaded area depicts the 95 per cent agreement interval, within which 95 per cent of the differences fall. For example, the 95 per cent limits of agreement for plot a are −11·3 to 25·6, indicating that for 95 per cent of observations a ruler measurement of wound area is between −11·3 and 25·6 cm2 larger than a tracing measurement. This plot was produced using the batplot command in Stata®, with the notrend option