. 2018 Mar 1;2(1):86–105. doi: 10.1162/NETN_a_00031

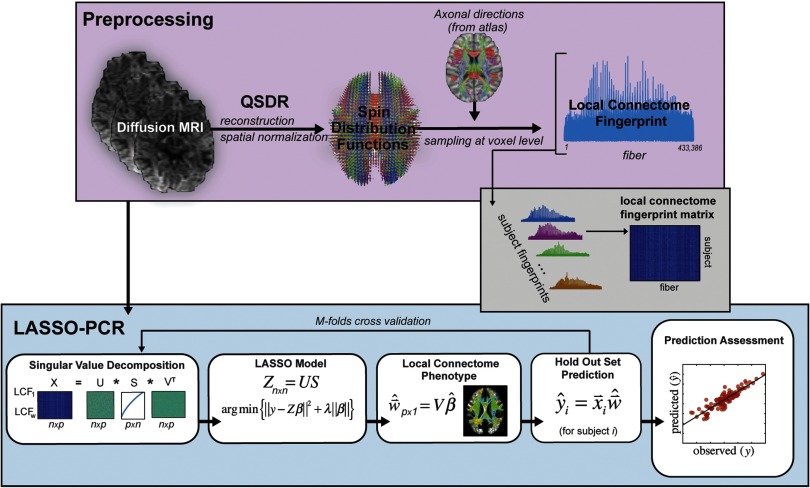
Figure 1. . Data analysis pipeline. dMRI from the HCP dataset were preprocessed consistent with previous research investigating the local connectome fingerprint (top panel) and included registration via QSDR and estimation of SDF using an axonal directional atlas derived from the HCP dataset. Once fingerprints were estimated for each individual, the pipeline for analysis of the continuous response variables consisted of four major steps: (1) a PCA-based dimensionality reduction, (2) a LASSO model based on the lower-dimensional components of the local connectome fingerprint, (3) local connectome phenotype estimation from projection of the contributing components of the LASSO model, and (4) prediction on the held-out dataset. A similar pipeline was used for categorical response variables with the exception that a logistic LASSO model was used in the LASSO-PCR step and prediction accuracy was assessed as percentage correct rather than as a predicted versus observed correlation.

Figure 1.