
Figure 3. Group Differences in Activation Time Course.
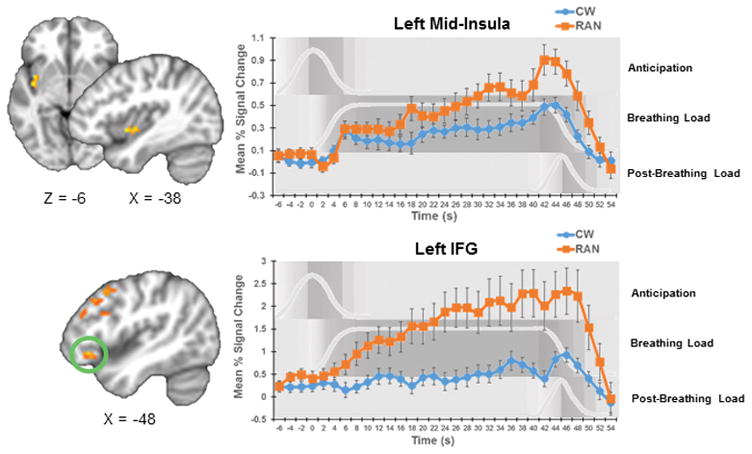
Group x Time interaction results suggested that the time course of activation in RAN participants statistically significantly differed from those of controls in left mid-insula and left IFG. Additional clusters in which time course differed between groups are shown in Figure S3. Time course graphs for anticipation, breathing load, and post-breathing load conditions are shown in in light gray and with gray shading the background. Error bars represent standard error of the mean. RAN, women remitted from anorexia nervosa; CW, healthy control women; IFG, inferior frontal gyrus.