
Figure 1.
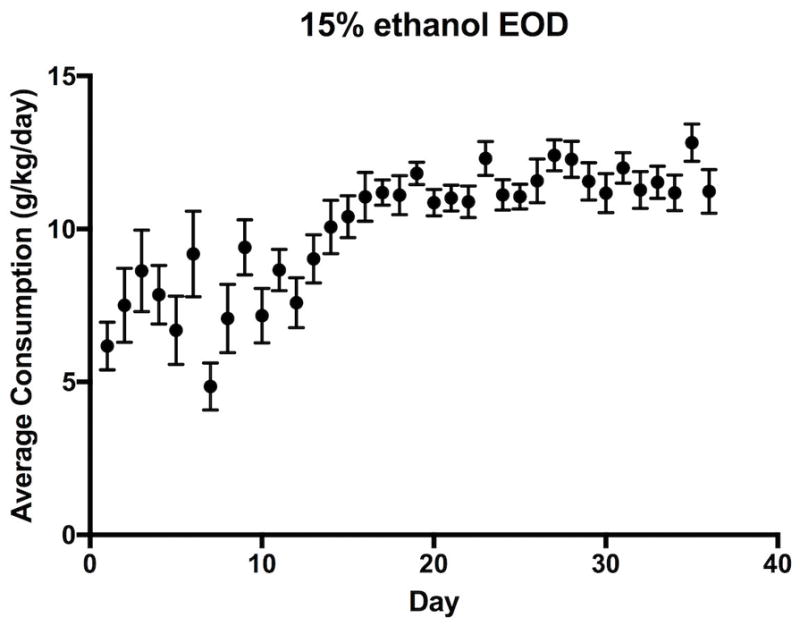
Ethanol consumption in voluntary every-other-day 2-bottle choice drinking paradigm. Values are shown as averages consumption (g/kg) over a 24-hour period with error bars showing SEM. Consumption is shown for days that alcohol was available only.