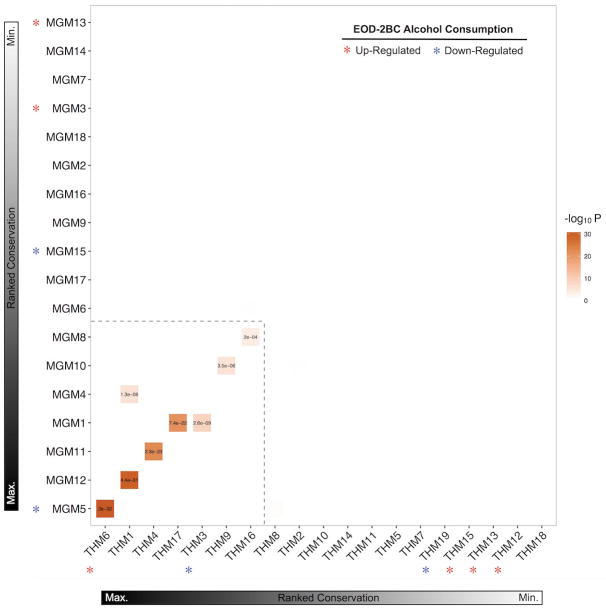
Figure 3.
Overlap between the microglia and total homogenate modules based on gene membership (Fishers-exact-test, correct for multiple comparisons using a false discovery rate less than .05). The modules contained in the hatched box show high overlap between the two fractions and likely represent shared genes and processes. The modules outside the hatched box are unique to that fraction. * denotes differentially expressed with ethanol (p < .05) and the color indicates the direction of the change.

